Whether wet or dry, Mother Nature just couldn’t make up her mind in North Carolina last year.
While 2021 was not particularly extreme in the final temperature or precipitation rankings, it was notable for the drastic seasonal swings between wet and dry weather and their impacts, from devastating floods to fire-sparking droughts.
The Year By the Numbers
The National Centers for Environmental Information (NCEI) reports a statewide average temperature last year of 60.1°F, which was 0.5°F warmer than the 1991 to 2020 average and ranks as our 16th-warmest year on record dating back to 1895.
A cool February and a seasonable start to summer kept us from rivaling the warmth of recent years, including our warmest year on record in 2019. However, 2021 was our seventh year in a row with above-normal temperatures, and 19 out of the past 21 years have been warmer than the historical average.
Locally, several observing sites recorded one of their top-ten warmest years on record. It was the 5th-warmest year in Wilmington, tied for the 9th-warmest in Charlotte, and the 10th-warmest at Hatteras.
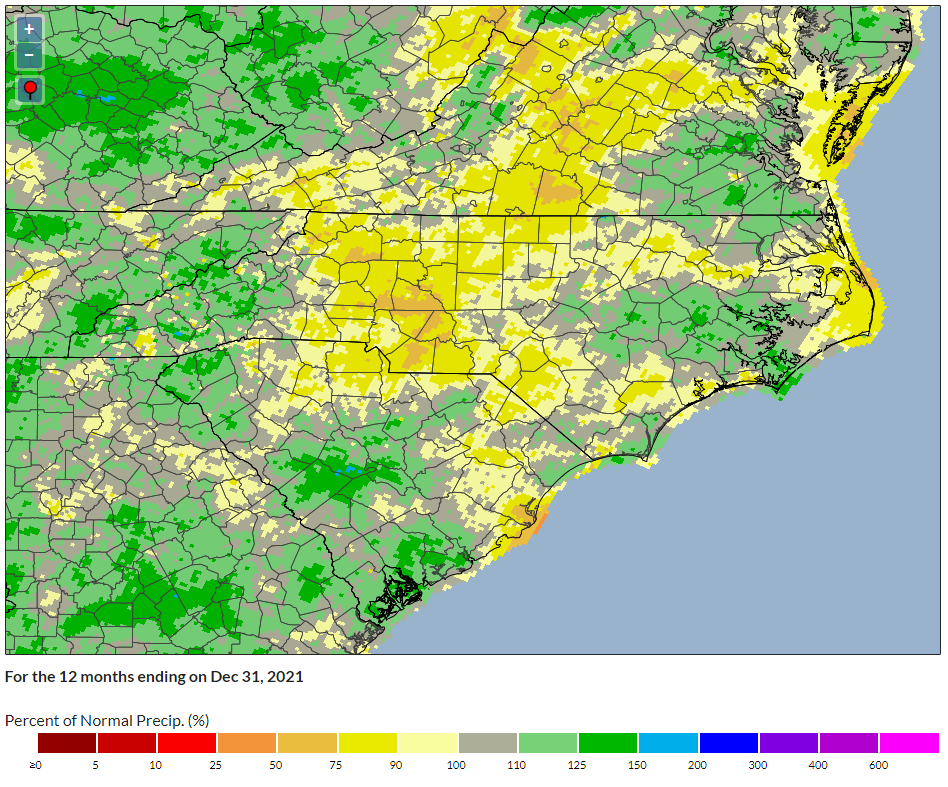
Per NCEI, the statewide average precipitation of 47.33 inches was 3.44 inches less than the 1991 to 2020 average, making it our 42nd-driest year out of the past 127 years. That broke our string of three consecutive wetter-than-normal years, which included our wettest year on record from 2018 and our second-wettest from 2020. It was also our driest year since 2012.
Local precipitation rankings show more variability, reflecting some areas that picked up heavier rainfall and others that began drying out sooner. Propelled by its wettest summer on record, Greenville had its 12th-wettest year since 1914. Late-summer rain from the remnants of Tropical Storm Fred fueled the 14th-wettest year on record in Asheville.
Without much tropical contribution to their rainfall, the western Piedmont and Sandhills were the driest areas last year. Lumberton had its 19th-driest year on record and it was the 20th-driest in Charlotte. Notably, Lincolntown finished the year 12.3 inches below its normal precipitation, which was the 8th-driest year there since 1958.
Seasons of Change
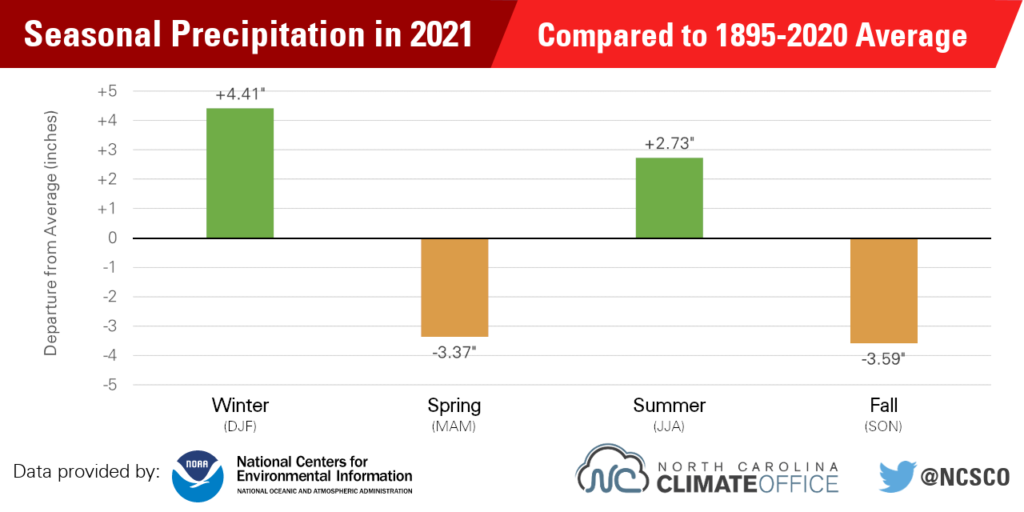
While those annual statistics are informative, they don’t fully capture our unusual precipitation pattern over the past year. Our last four seasons – from the winter of 2020-21 through the end of fall last November – alternated between wet and dry.
While we’ve seen such a seasonal oscillation before – in fact, it has occurred 15 times within a calendar year since 1895 – it has never happened to the extreme degree as we saw last year. Each season in 2021 was more than 2.5 inches above or below the long-term average precipitation, which means our wet seasons (winter and summer) were especially soaking and our dry seasons (spring and fall) were particularly parched.
The year started amid a wet winter that defied the expected impacts of our La Niña pattern. Multiple storm systems from the Gulf of Mexico crossed the state, including in our 17th-wettest February on record. However, snow was mostly limited to a minor event across our northern counties in late January, and the Triad endured a pair of ice storms in mid-February.
The start of March brought several weeks of dry weather that overstayed their welcome through the rest of the spring. By the end of our 13th-driest May on record in which some areas received less than an inch of rain, nearly half of the state was classified in drought, making it our most widespread drought since October 2019.
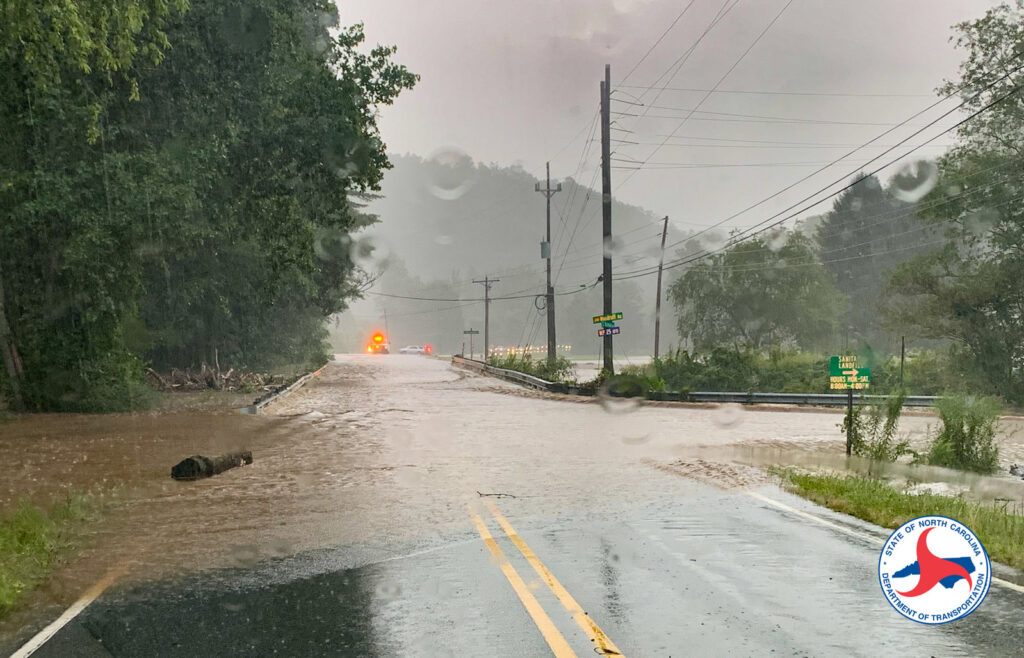
A new season again brought an abrupt pattern change, with heavy rains in early June quenching the driest areas of eastern North Carolina. Each summer month saw a tropical system affect parts of the state: Claudette in June, Elsa in July, and the remnants of Fred in August. In some areas, this rain was too much of a good thing. A wet week ending with Fred produced near-record river crests and devastating flooding in the Mountains that claimed six lives.
While the tropics remained active through the peak of the season in September, and the Atlantic hurricane season ended with 21 named storms – the 3rd-most on record – the late-season storms mostly missed the Southeast US. In North Carolina, a persistent warm and dry pattern helped drought re-emerge and ignited an active fall fire season featuring a November blaze on Pilot Mountain.
Our current drought peaked in mid-December, with more than half of the state classified in Severe Drought (D2) for the first time since July 1, 2008. Since then, January’s widespread rain and snow have brought some improvements, although precipitation and groundwater deficits dating back to the fall have continued to keep drought present in many areas.
A Hazardous Year Nationally — What About NC?
Across the country, NOAA has confirmed 20 weather and climate disasters in 2021 with damages of at least one billion dollars. That ranks second behind only 2020, with 22 disasters. Last year’s events ranged from the February deep freeze in the Southern Plains to the June heatwave and western wildfires to Hurricane Ida to the December tornado outbreak to our west.
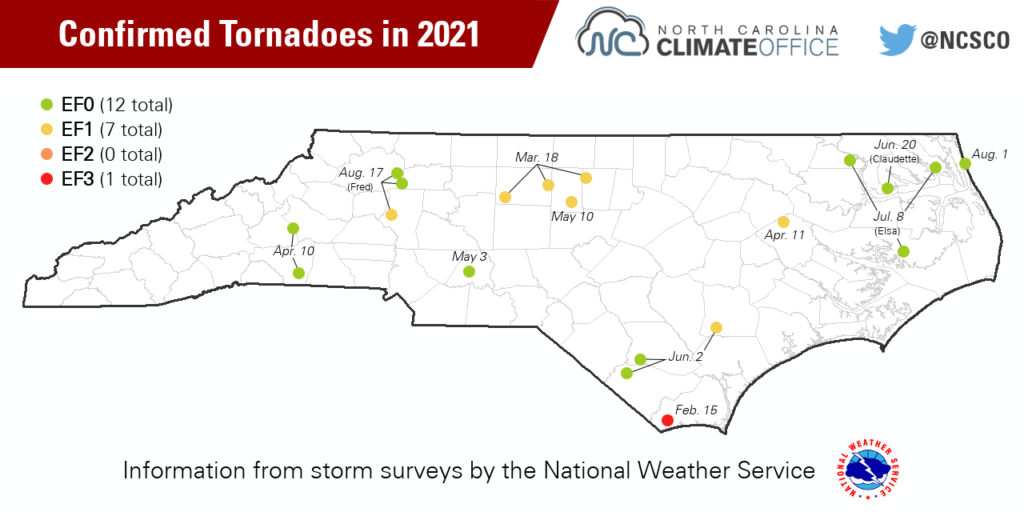
Aside from Tropical Storm Fred, North Carolina missed the worst of those disasters. Even our severe weather was relatively mild, with only 20 confirmed tornadoes – down from the 30-year average of 31.3, and well behind the 47 tornadoes in 2019 and the 48 in 2020.
A few factors helped us avoid the brunt of these hazards:
- The topography of the Mountains tends to weaken cold fronts moving in from the west, even if it also wrings out their moisture. That means the patterns that drove our dry spring and fall effectively shielded us from the severe weather on the other side of the Appalachians.
- The large-scale patterns that fueled events like the western wildfires brought more benign weather to our part of the country. While June saw record heat in the Northwest beneath a towering upper-level ridge, we were cooler and comfortable in the Southeast under a downstream trough, or a southward dip in the jet stream. (The main consequence of that pattern for us was several days with poor air quality as smoke filtered in from those far-flung fires.)
- A little luck may have been on our side, too. For instance, had Hurricane Ida shifted even 100 miles to the east, it would have likely brought heavy rain to parts of the Mountains that were still recovering from Fred’s flooding just two weeks earlier.
- The nearby bodies of water – the Atlantic Ocean and Gulf of Mexico – that make for some muggy summers also moderate our overall climate, so we tend to avoid the extremes of other parts of the country. To that point, most of North Carolina had an annual temperature range of only 70 to 80 degrees last year, from the coldest wintertime lows in the 20s to the hottest summer afternoons in the 90s. That’s a far cry from the 100+ degree range observed across the Midwest.
Despite a relatively non-extreme year overall, 2021 still offered several reasons to remember it in the future.
For one, Fred’s flooding was a historic event of a similar magnitude as Frances and Ivan in 2004, and it set the bar by which future storms will be measured in the hardest-hit areas such as Haywood County.
The end-of-year drought, including our driest November in 90 years, showed just how dry conditions can get in the fall, even following a wet summer. The streamflow gauge on the Big Swamp near Tar Heel in Robeson County spent most of November and December at record low levels for that time of year, bottoming out below the levels observed during our drought of record from 2007.
Finally, our back-and-forth, wet-and-dry seasonal swings kept everyone from farmers to foresters to forecasters struggling to keep up with the changing weather. However, evidence suggests that extreme seasons like we saw in 2021 may become more common going forward — and it’s one of many trends observed last year, both in North Carolina and around the world.
The Past Year in Perspective
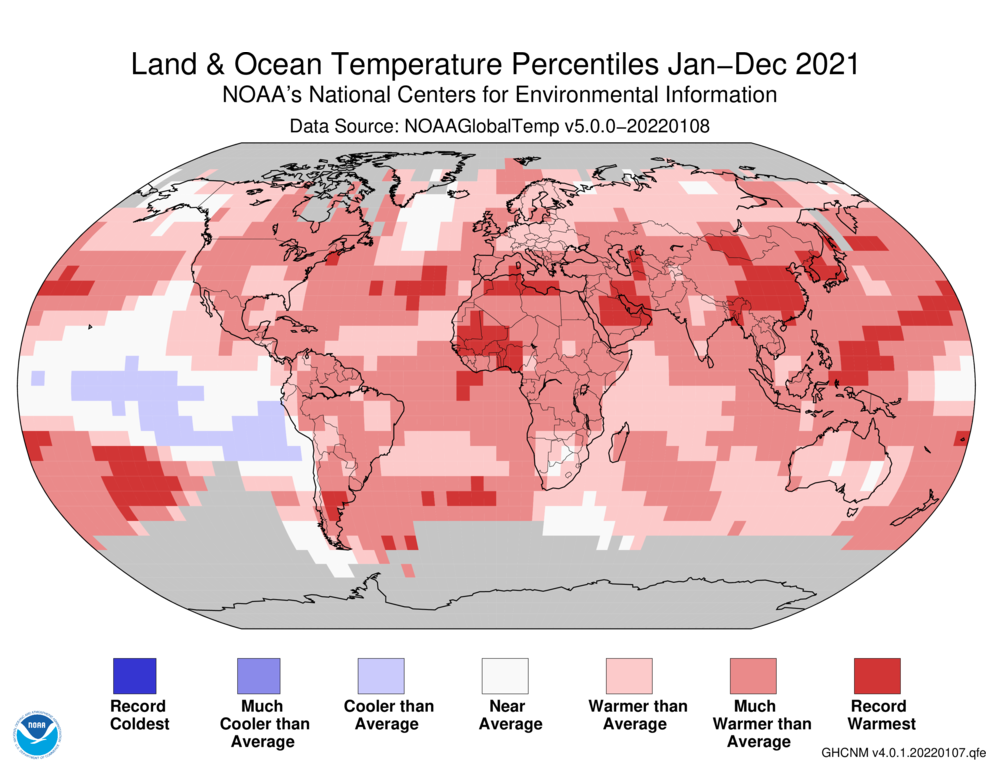
Globally, 2021 was the 6th-warmest year on record, according to calculations from both NOAA and NASA. That high ranking came despite the year being bookended by back-to-back La Niña events, which are characterized by cooler conditions across the equatorial Pacific Ocean that tend to dampen global temperatures.
Even still, 2021 was the warmest La Niña year on record, and as NOAA reports, it was the 45th consecutive year — dating back to 1977 — with global temperatures exceeding the 20th-century average.
Digging deeper into our statewide statistics, the average minimum temperatures in 2021 ranked as the 11th-warmest on record, on the heels of six consecutive years that each set or tied the record for our warmest nighttime lows. NCEI also notes that our average maximum temperatures in 2021 ranked as the 21st-warmest on record.
Even though we didn’t feel the same extremes as other parts of the country last year, overall above-normal temperatures are still a cause for concern. Prolonged exposure to elevated daytime and nighttime temperatures presents public health risks, especially in areas without sufficient access to cooling, and elevated temperatures can pose challenges for farmers.
Our seasonal precipitation swings in 2021 highlight another aspect of our changing climate that is expected to continue. As the NC Climate Science Report notes, precipitation events are increasing in intensity, but the gaps between these events are getting longer — meaning the wet days will be wetter, and the dry periods even drier.
That means our future climate may look a lot like 2021. Storm systems — whether they’re ice storms, tropical storms, or just pop-up thunderstorms — will produce more extreme precipitation totals. Then, only a few weeks or months later, that moisture may be a mere memory as droughts envelope the state.
Get ready for more of that sort of weather whiplash, because a changing climate will include more flooding and more drought, often within the same year.
Upcoming Events
If you want to learn more about our climate, make sure to check out these webinars:
- South Carolina’s year in review (January 27 from 10 to 11 am)
- Southeast Chapter of the National Climate Assessment, Public Engagement Workshop 1 (January 31 from 6:30 to 8:30 pm or February 1 from 11 am to 3:30 pm)
- Raleigh and Durham Urban Heat Island campaign results (February 3 from 6 to 7 pm)