The State Climate Office and the North Carolina Division of Air Quality (NCDAQ) have partnered to build a new monitoring tool for those times when there’s something in the air, whether that’s a simmering summer afternoon, a gray and hazy evening, or even the hours after a holiday celebration. (Don’t worry, we’ll explain that one!)
The Ambient Information Reporter, or AIR, tool combines a wealth of statewide weather observations from the ECONet and National Weather Service with air quality monitors and forecasts from the NCDAQ, and it’s all packed within an innovative map-centered interface.
The result is a tool that’s powerful enough to help forecasters track evolving air quality hazards, but accessible enough to let you quickly check conditions before you step out the door into the unknown air beyond.

A Tour of the Tool
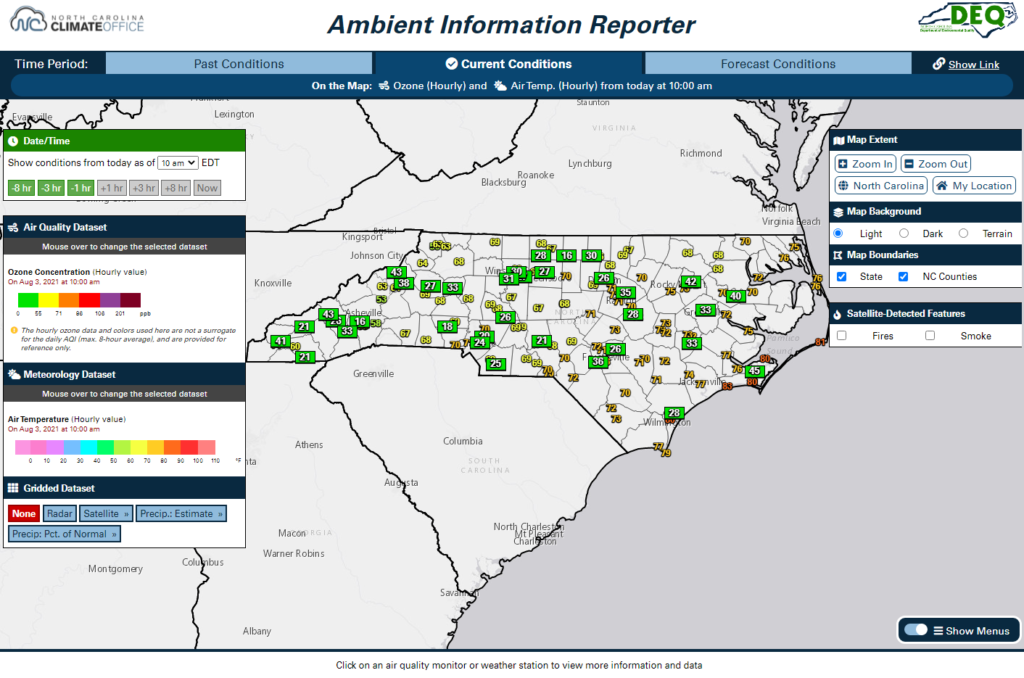
Front and center on the AIR tool are the map and data selection menus, and these are all you need to view the latest conditions. By default, the current ozone concentrations and air temperatures are shown on the map, but you can change these in the “Air Quality Dataset” and “Meteorology Dataset” menus.
To view data from earlier in the day, change the time in the “Date/Time” menu, or to view a past date (going back to 2016), select the “Past Conditions” time period at the top of the page.
You can also view three-day Air Quality Index (AQI) forecasts by choosing the “Forecast Conditions” time period. These official county-based forecasts are issued by NCDAQ for all of North Carolina, with the exception of the Triad region, which is covered by an area forecast issued by the Forsyth County Office of Environmental Protection and Assistance.
When you’re viewing air quality monitor or weather station data on the map, click on any site to view a popup containing a summary of its reported conditions. For each parameter, you can click the “plot” link to load a graph — either recent hourly observations, or a detailed month-by-month breakdown showing when the highest and lowest values have occurred for daily-aggregated datasets including the AQI.
Note that air quality data comes from the official statewide monitoring network operated by NCDAQ and its partners, including the US Environmental Protection Agency, Mecklenburg County Air Quality, the Forsyth County Office of Environmental Assistance and Protection, the Eastern Band of Cherokee Indians, and the Western North Carolina Regional Air Quality Agency. These high-quality air monitors offer the most accurate measurements of ambient conditions, and as the following examples show, they can provide impressive insights and curate confidence in cases of unusual air quality.
Ozone Outbreaks
Our hottest summer days can have some of the worst air quality to boot. As we’ve explained in the past, ozone — a pollutant with respiratory repercussions — forms in ample sunlight, generally dry air, and light winds, which are common conditions during North Carolina heat waves.
While recent regulatory efforts to curb emissions have succeeded in significantly improving air quality across the Tar Heel State, we still usually experience at least a few Code Orange ozone days (classified as Unhealthy for Sensitive Groups) especially in our metropolitan areas when atmospheric conditions and anthropogenic activity align just right.
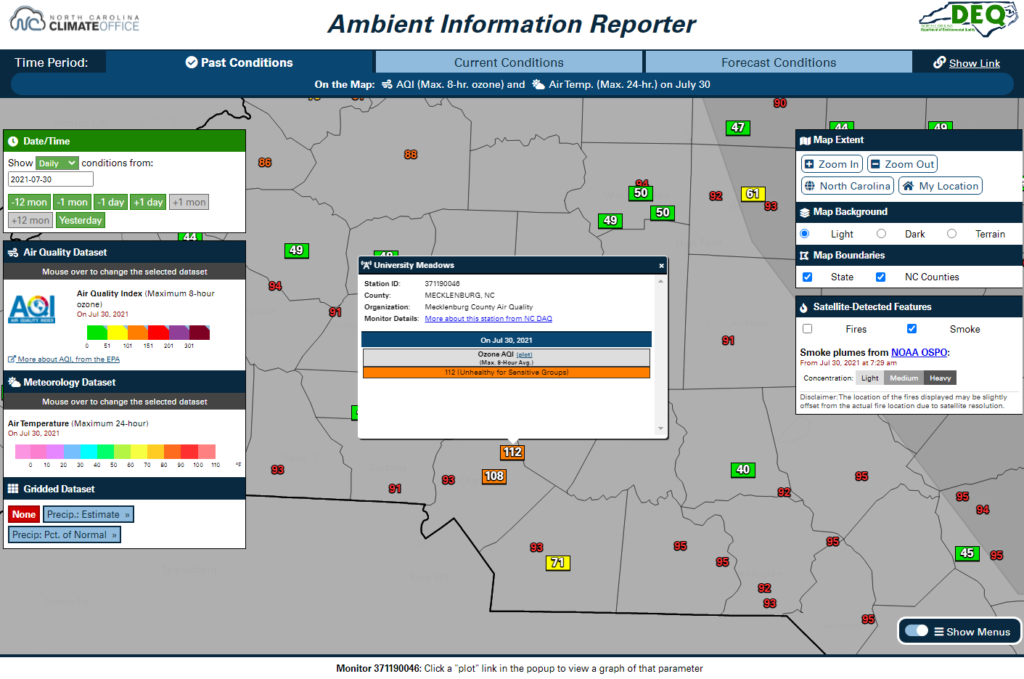
Friday, July 30 was just such a day, as hot weather, sunny skies, and a smoke-laden air mass originating from wildfires in Canada created favorable conditions for significant ozone formation. Checking the Past Conditions tab in the AIR tool, the Air Quality Index based on the maximum 8-hour ozone concentrations shows Code Orange conditions were observed in the Charlotte area.
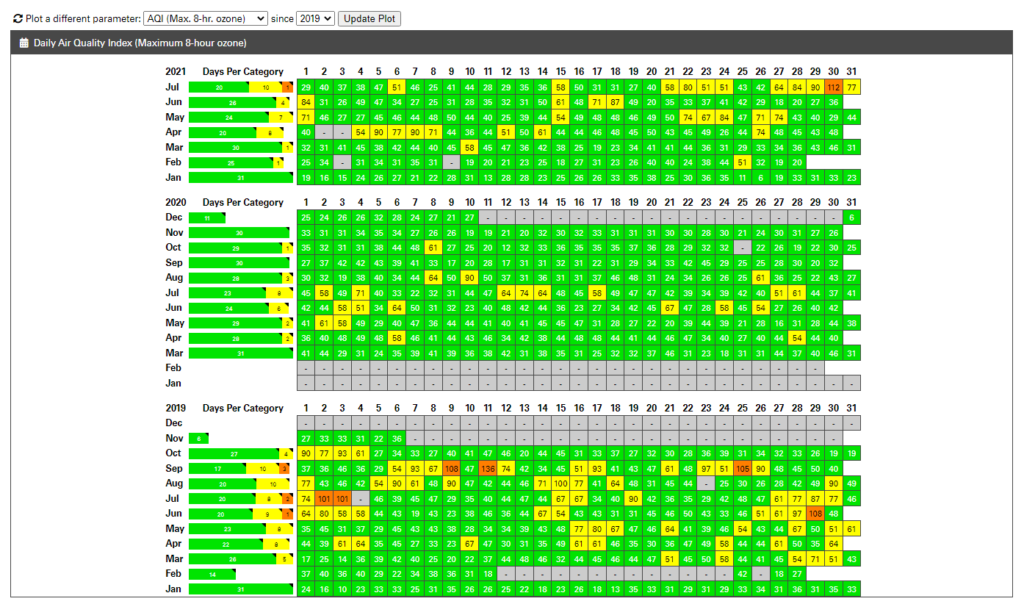
Clicking one of these monitors and plotting the ozone AQI gives a historical rundown of daily conditions. Interestingly, this was the first measured Code Orange ozone day since September 25, 2019 at this monitor!
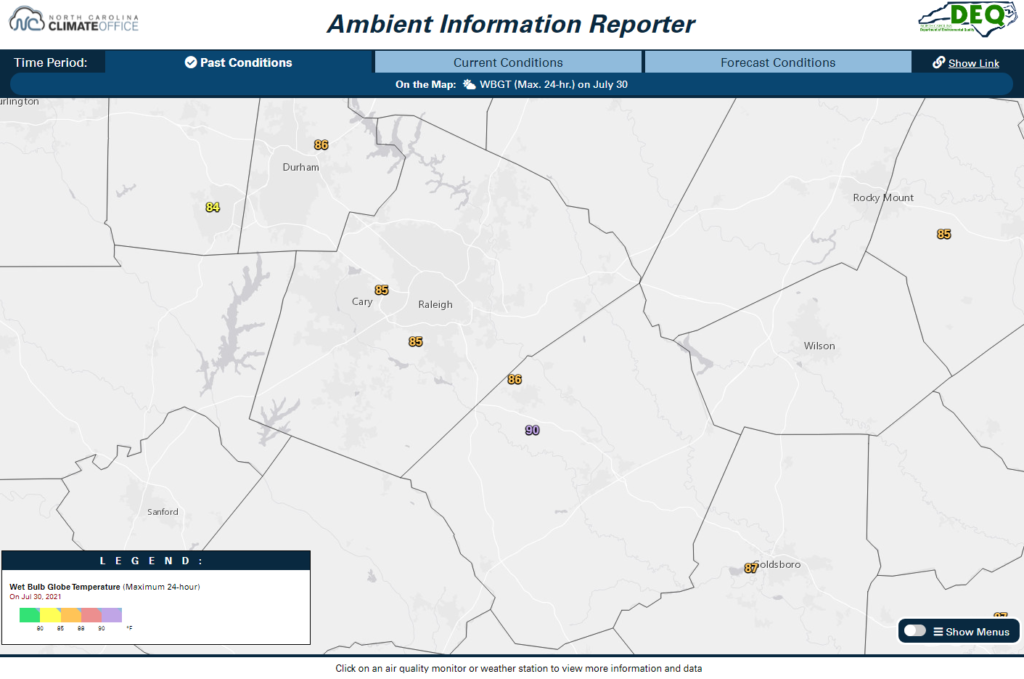
On hot days like this one, ozone often isn’t the only concern when spending time outdoors. Heat stress can be an issue as well, and viewing the WBGT meteorology dataset shows that the maximum wet bulb globe temperature — a measure of heat exposure in direct sunlight — hit the Extreme range in Clayton that Friday afternoon.
Where There’s Smoke, There’s Fine Particulate Matter
As anyone who’s stepped too close to a campfire or backyard debris burn knows, inhaling a breath full of smoke can cause major irritation to the lungs. On a larger scale, one of the main sources of smoke is from intense or long-lived wildfires.
Some of the most irritating pollutants to the lungs contained within wildfire smoke are very small — about 30 times smaller than a human hair — and as such are classified as fine particulate matter, or PM2.5. These tiny particles are less than 2.5 microns in diameter, so they are easily suspended in the air and able to travel long distances.
Because of that, fires don’t need to be burning within the state — or even on this side of the country! — for us to see and feel their effects. Last month, the prevailing westerly winds carried smoke from fires in the western US and central Canada all the way to North Carolina.
Using the AIR tool, you could have kept an eye on the rising PM2.5 concentrations throughout the day, and how they could have been affected by the weather.
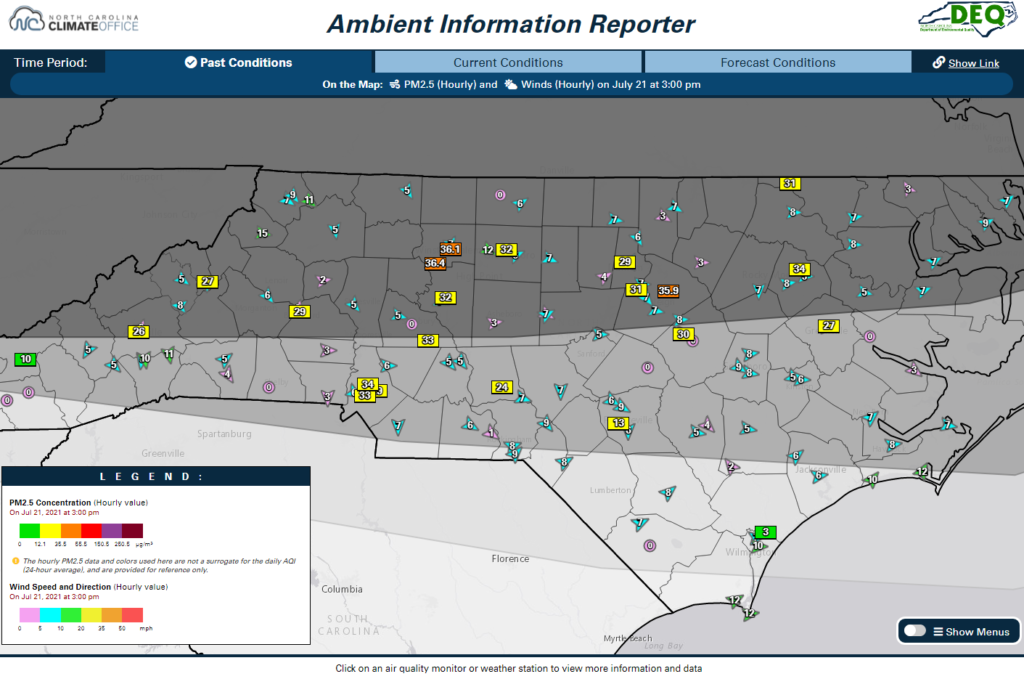
On July 21, elevated PM2.5 levels began to appear in the Triad, and northwesterly winds were set to spread this smoky air to the south and east.
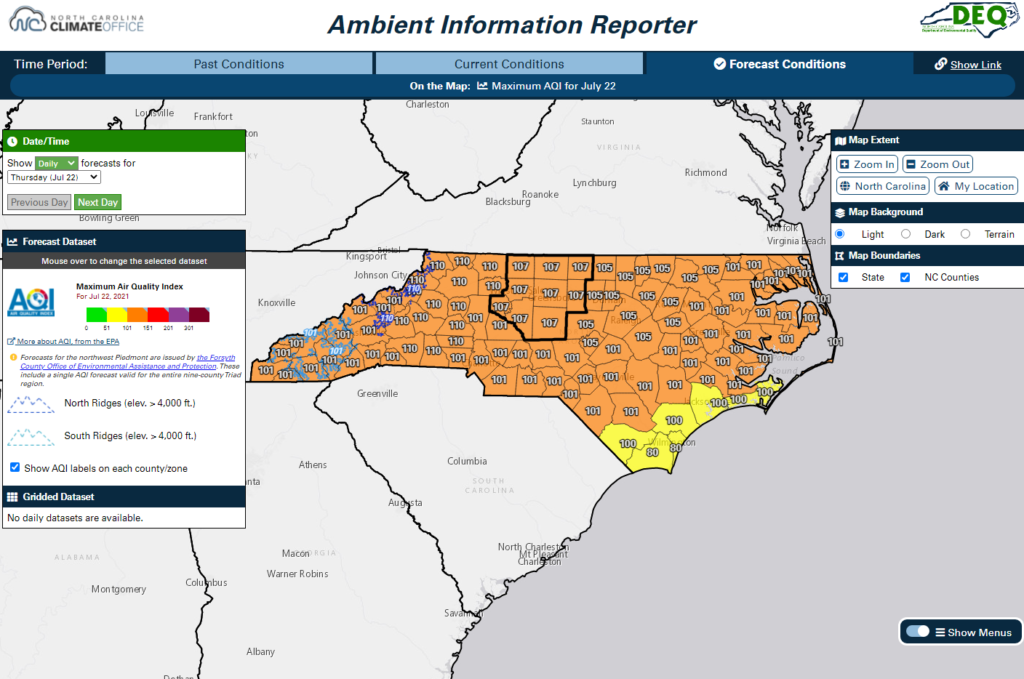
If you were downwind of these higher concentrations, you might have expected your own air quality to worsen. Sure enough, official forecasts for the next day called for widespread Code Orange conditions driven by those elevated PM2.5 levels.
Oh Say, Can You… Smell?
Fireworks displays on the Fourth of July can be a beautiful sight, but this year, their after-effects lingered in the air for a surprisingly long time.
If you’d woken up on July 5 and caught a whiff of something smoky from the night before, the AIR tool could have offered clues about when, where, and why the air quality was so poor.
The hourly PM2.5 concentrations were the highest in cities, including Charlotte, Raleigh, and Fayetteville, with much lower values in rural areas. That’s the first clue that this wasn’t caused by a large-scale feature like wildfire smoke.
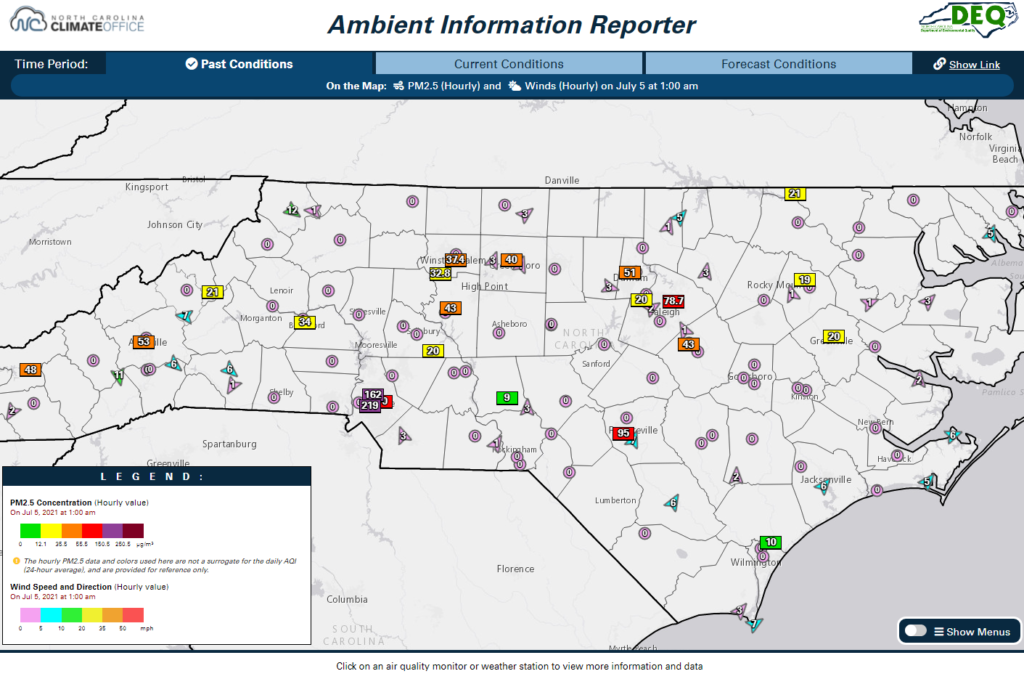
Very light to calm winds meant that any pollutants in the air wouldn’t travel very far from their sources, so those extreme hourly values in Charlotte — including some equivalent to the Code Purple range if they had remained that high for the entire 24-hour period — likely originated nearby.
Viewing the graph of hourly concentrations showed they began rising around 10 pm on July 4 — right when the evening fireworks shows were wrapping up. After spiking just past midnight, the PM2.5 concentrations steadily declined through the following morning.
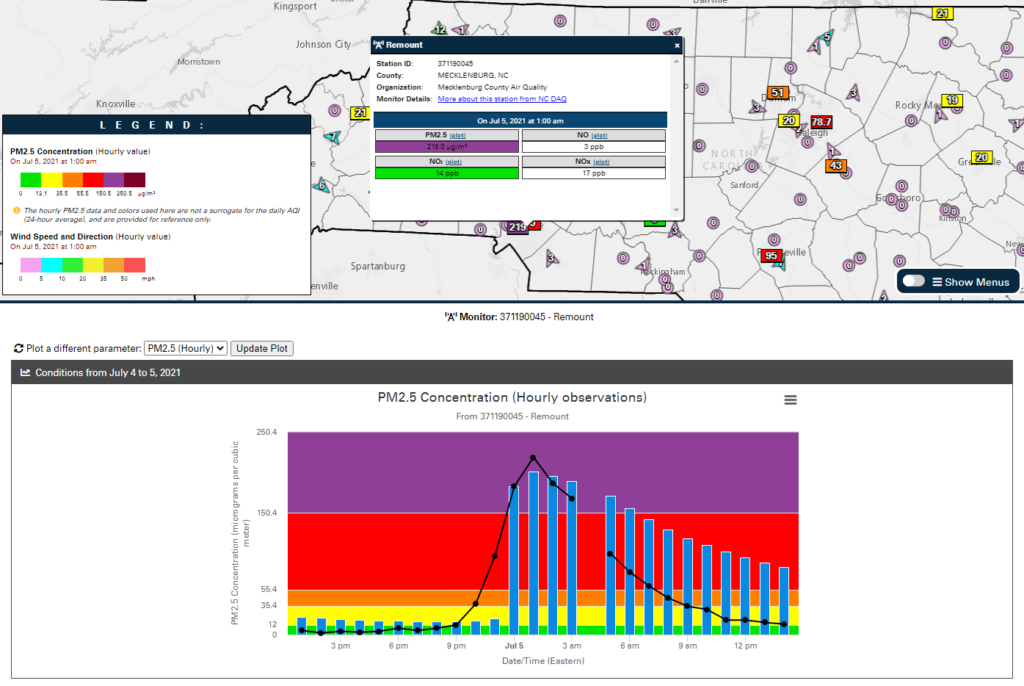
Piecing those clues together and remembering the airborne snaps, crackles, and pops from the night before would have offered a reasonable, if perhaps unexpected, explanation to the source of the poor air quality early on July 5 this year.
Data at Your Fingertips
The AIR tool is now live and available at: https://airquality.climate.ncsu.edu/air/
The tool has been developed with both desktop and mobile environments in mind, so whether you’re at home on your computer or out for a walk with only your smartphone, you have access to the data and features of the tool on any platform.
This is the first of many expected products to come out of the collaboration between the State Climate Office and the NC Division of Air Quality. In the coming months, we will also be developing an Air Quality Portal for North Carolina, including educational resources and additional data displays such as a dashboard with current conditions and forecasts for locations across the state.
In the meantime, you can breathe easier knowing Air Awareness is in your hands with the Ambient Information Reporter.