With spring springing and blooms blooming, the winter has wrapped up in North Carolina. While we can’t rule out additional frost or freeze events this spring, we can close the book on the winter, and it tells the story of a season dominated by the effects of a strong El Niño. Our recap of the winter includes the monthly and seasonal rankings, a closer look at the El Niño event, a month-by-month summary, and a review of our seasonal outlook.
Winter Rankings
The meteorological winter — December through February — was warm and wet on the whole. The average statewide temperature of 44.61°F ranks as the 16th-warmest since 1895, and the average precipitation of 16.71 inches ranks as the 4th-wettest winter in that same 122-year period. That precipitation total is about 1.5 inches behind our wettest winter on record from 1997-98; we have more comparisons to that winter below.
| Month | Temperature Ranking | Precipitation Ranking |
|---|---|---|
| December | 1st-warmest | 1st-wettest |
| January | 32nd-coolest | 49th-driest |
| February | 64th-warmest | 5th-wettest |
Each month’s temperatures showed distinct differences: December had record-breaking warmth, January switched to a cooler pattern, and February’s temperatures were near normal on average, but quite variable overall. Along with its record warm temperatures, December was also the wettest on record for North Carolina. January was on the dry side, but wet weather returned in February.
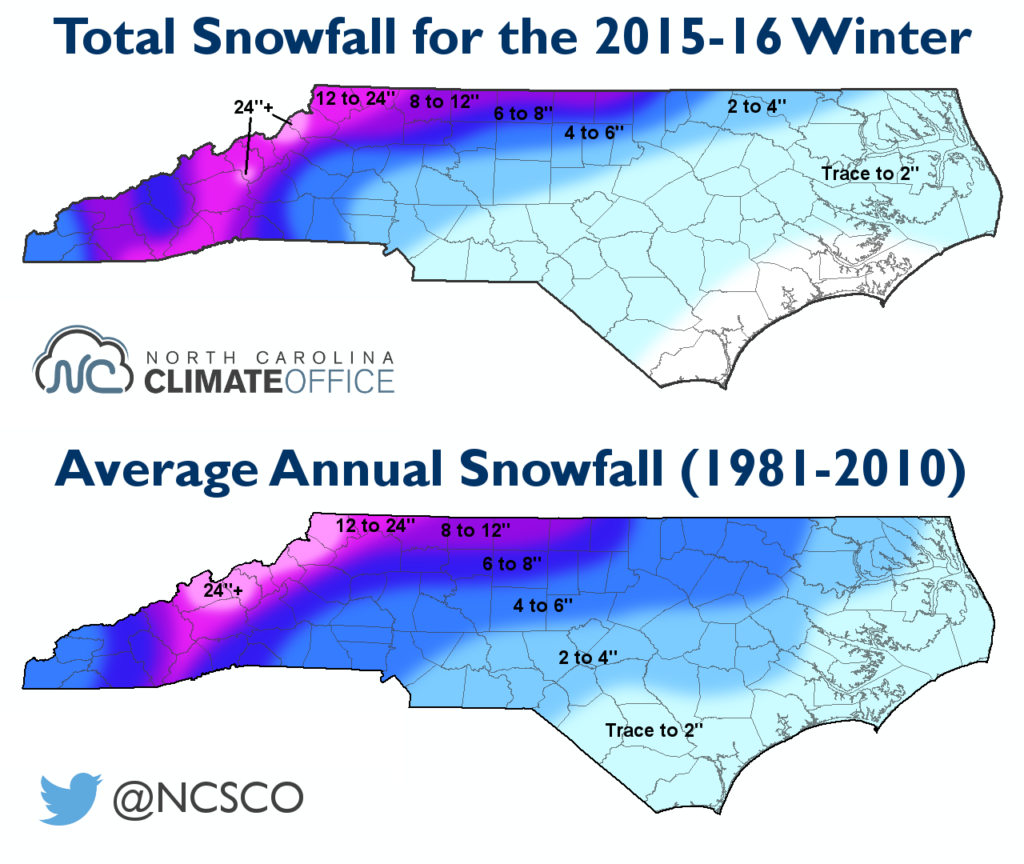
While it was a wet winter, most of the state saw below-normal snowfall. Raleigh had just 1.4 inches compared to a normal of almost 6 inches. Greensboro had 4.5 inches — below the normal of 7.6 inches — and Charlotte’s snow total of 3.3 inches was about an inch below normal. Some parts of the Mountains did meet or exceed their normal snowfall, including Asheville, where the total accumulation of 13.9 inches was 4 inches above normal.
A Strong El Niño Peaks
In December, central Pacific sea surface temperature anomalies peaked at nearly 3°C above normal. By some measures, it was the strongest El Niño event on record since 1950, although direct comparisons with other El Niño episodes aren’t quite so clear-cut.
The exact strength of the El Niño depends on which region of the Pacific is used for measurement, and as we discussed in our Winter Outlook series, this winter’s event was a more central or basin-wide event, while the 1997-98 El Niño had the greatest sea surface temperature anomalies farther east.
Exact numbers aside, the strong El Niño had significant impacts on North Carolina. Beginning with soaking rains last fall, a moisture-rich storm track to our south fueled a string of wet months, including our wettest October and December on record, the 3rd-wettest November, and the 5th-wettest February.
So why was the winter so wet but with below-normal snowfall? El Niño and some other large-scale patterns all played a part in limiting our snow totals.
Warm water off the coast of California and Mexico — part of a positive-phase Pacific Decadal Oscillation (PDO) — was expected to cause polar jet stream ridging and warm weather over the west coast. That would’ve favored troughing and cooler weather over the east coast. However, that ridging could never become well-established before it was cut down by the El Niño-enhanced tropical jet stream.
In addition, pieces of a splitting polar vortex never dove far enough south and east to deliver the necessary infusion of cold air for a major snow event. Without a strong high pressure system to our north during our few wintry events, atmospheric temperatures were marginal so precipitation transitioned from snow to sleet, freezing rain, or rain.
In addition, the lack of a strong high allowed storms to track farther north and west, which also let more warm air creep in from the south during those events. That effectively kept the southern coast snow-free this winter.
Monthly Summary
In our Winter Outlook from November, we noted that the strong polar vortex in December should hinder any wintry potential and bring near- to above-normal temperatures, and did it ever! That December warmth drove what was otherwise a near-normal winter fairly high on the list of our warmest winters.
As we discussed in our outlook, that polar pattern relaxed by January, and we then entered a colder and more wintry pattern, albeit a brief one. By mid-January, the Arctic Oscillation (AO) and North Atlantic Oscillation (NAO) entered a negative phase, which signaled a weakening polar vortex and the first shot of cold air during the winter.
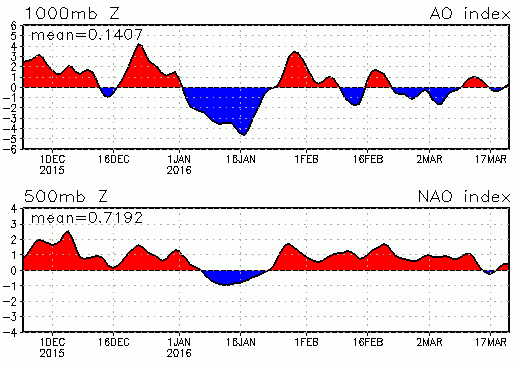
Storms continued tracking up the east coast during this time when cold air was in place near the surface, and we saw two wintry events: a dusting of snow on January 17 and a wintry mix on January 22-23, which is a contender to win our ongoing Top NC Weather Event tournament.
After those events, the negative AO pattern receded before briefly returning midway through February. The coldest air of the season arrived on Valentine’s Day and set the stage for more wintry weather that night. The next day, though, the southerly jet stream again delivered a feed of warm, moist air, which caused rising temperatures and a precipitation transition from snow and ice to rain and storms.
As predicted, cold air availability began to decrease by late February and early March, ending our chances for wintry weather. In fact, the end of February felt more like spring, with warmer temperatures and a severe weather event on February 24.
Our Seasonal Outlook Reviewed
Given the strength of the still-developing El Niño event, the wet winter was not unexpected when we issued our Winter Outlook. As predicted, we did indeed see above-normal precipitation and numerous precipitation events throughout the winter.
While our monthly predictions and expectations for a wet winter played out nearly as expected, our Outlook also called for above-normal snowfall, which was not the case for most of the state. The likelihood of an active storm track and at least some periods with cooler temperatures made this seem like a safe prediction, but looking back, we really underestimated the impacts of the strong southerly jet stream.
| Reviewing the Predictions from Folklore: The colored bands on Banner Elk’s festival-winning woolly worm suggested a snowy start to the winter with near-normal temperatures and little snow by mid-February. It missed the timing of the snow, but was close on February’s temperatures. Two famous almanacs — The Old Farmer’s Almanac and the Farmers’ Almanac — had similar winter predictions, calling for cool, wet weather across the Southeast US. It was a wet winter, but not a cool one. The Old Farmer’s Almanac did correctly predict below-normal snowfall. Two of North Carolina’s groundhogs — Sir Walter Wally and Queen Charlotte — predicted an early spring. While cool, wintry weather stuck around through mid-February, spring-like conditions indeed arrived after that. |
In hindsight, the 1997-98 winter, which was one of the past analog years we looked at, should’ve been a bigger clue about these impacts. That winter was also largely warm and wet with limited chances at snow thanks to the unrelenting El Niño-fueled firehose to our south and the lack of cold air to the north.
The other close analogs had more snow, but that was mostly due to one or two widespread snow events in each year. For example, 1972-73 had just two wintry events of note, yet both were significant statewide snows. And like this year, most of the snow in January and February of 1983 was in northern and western North Carolina. However, a rare late March snow in southern and eastern parts of the state boosted that winter’s totals.
Without enough cold air in place during our wintry events to support all snow, mixed precipitation cut into our snow totals. Across the Piedmont, the late-January and mid-February events had liquid precipitation totals of half an inch or more, but much of that fell as sleet, freezing rain, or rain instead of snow. We noted this caveat in our outlook, and it turned out to be a key factor in our snow totals, or lack thereof.
Although we don’t have much snow to show for it, this winter — beginning with a record-setting December and ending with a wet and quite active pattern in February — will likely be remembered as one that showed the impressive effects of a historically strong El Niño.