Our Winter Outlook series has already covered the latest on El Niño and polar patterns. Today’s post looks at past years with similar conditions to see how those winters turned out and what it means for this year.
Like the snowflakes that can seem so rare around these parts, every winter is different in North Carolina. That’s one of the reasons predicting them is so challenging. But by examining similar past years, or analogs, we can get an idea for the range of possibilities this winter.
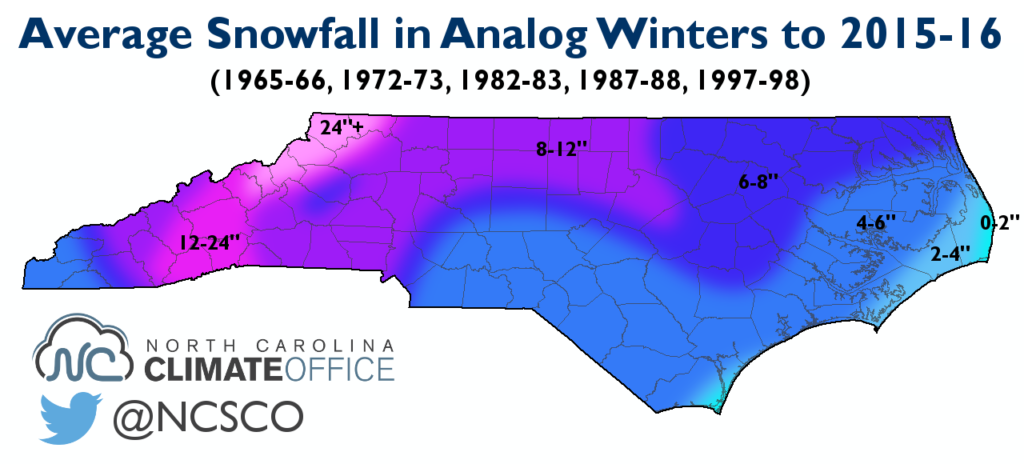
We found five close analogs to the current and expected conditions this winter: 1965-66, 1972-73, 1982-83, 1987-88, and 1997-98. All five years had moderate to strong El Niño conditions, but with slightly different strength, position, and timing. Conditions elsewhere in the atmosphere, such as with the North Atlantic Oscillation and polar jet stream, were also a bit different in each year. Studying these differences helps paint the picture of what’s possible this year.
1965-66
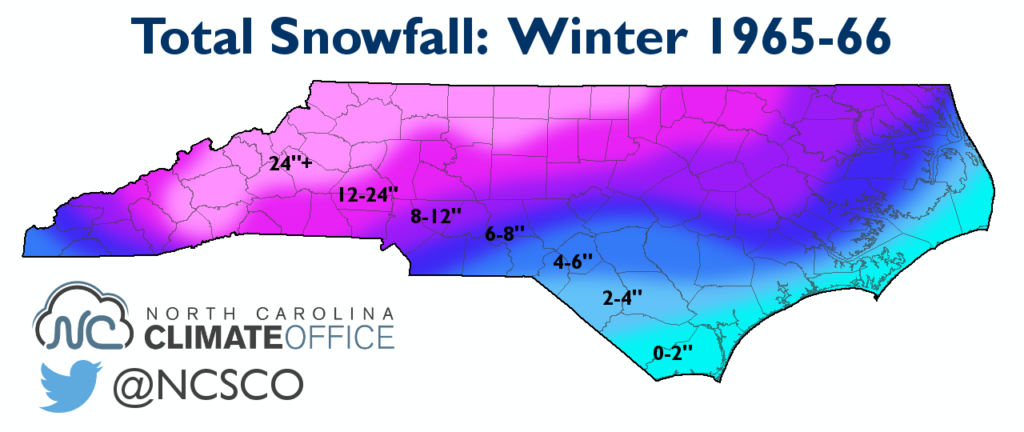
What Happened: A moderate El Niño paired with a negative NAO in January and February provided a favorable setup for cool temperatures and wintry weather. We had three major snow events in the second half of January, each bringing 6- to 12-inch accumulations to parts of the state.
Winter Storms: Jan. 15, Jan. 25, Jan. 29-30
Statewide Rankings (since 1895): 45th-coolest, 58th-wettest winter, including the 16th-coolest January
How it Compares to This Year: The El Niño peaked late in the fall, similar to what we expect this year. But the 1965-66 El Niño, while weaker than we have now, was a west-based or “Modoki” event, which generally favors wintry weather setups in North Carolina. The January and February NAO values were also among the strongest negative values on record. While that’s not out of the question for this winter, it’s certainly not something we see every year.
1972-73
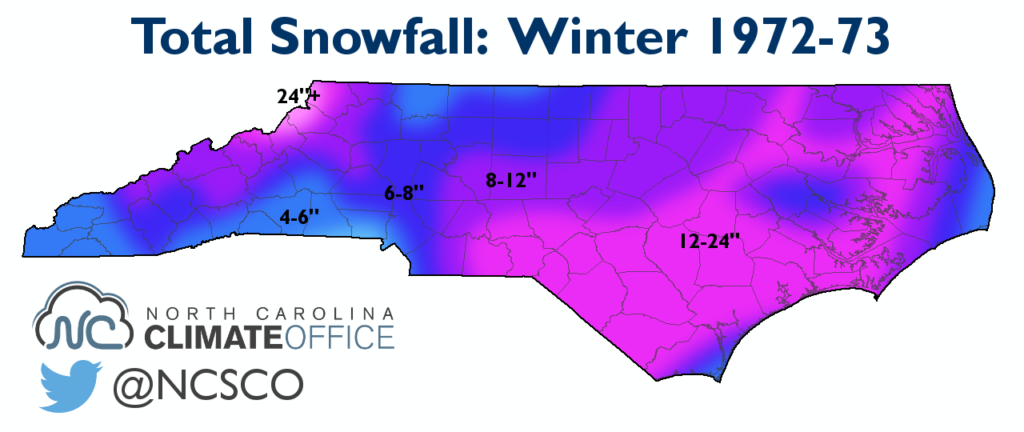
What Happened: Strong El Niño conditions made for a wet winter, but a neutral NAO pattern for most of the winter did not provide the persistent blocking needed for sustained cold weather. North Carolina had two major wintry events: one statewide snowfall in early January and a significant coastal snowstorm in early February.
Winter Storms: Jan. 7-8, Feb. 9
Statewide Rankings (since 1895): 38th-warmest, 26th-wettest winter, including the 15th-warmest December
How it Compares to This Year: The strength, position, and timing of the 1972-73 El Niño event are all similar to what we’re seeing this year, as is the October Siberian snowfall in 1972. Because of those similarities, this represents perhaps the closest analog to 2015-16.
1982-83
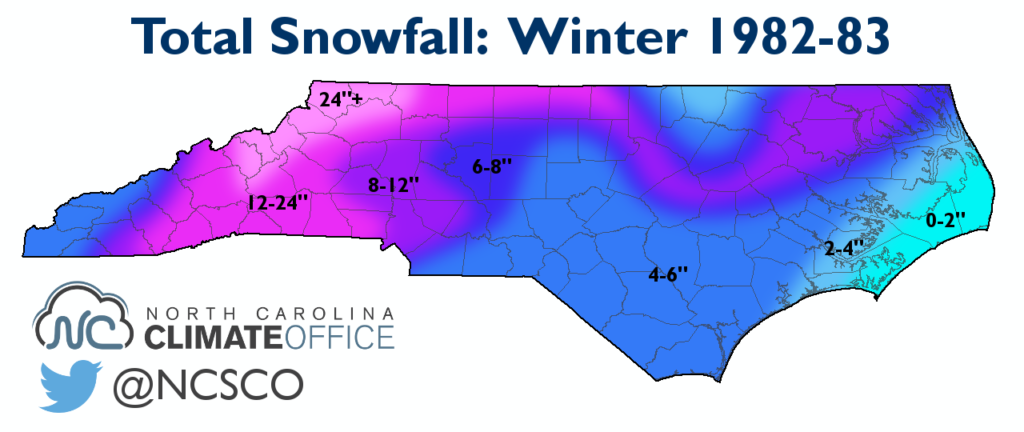
What Happened: This strong El Niño winter started with a warm December, but polar patterns became favorable for wintry weather after that. From late January to mid-February, there were three snow and ice events primarily in western North Carolina. The Piedmont and Coastal Plain saw a major snow in late March, and several sites saw accumulating snow in a rare April event.
Winter Storms: Jan. 20-21, Feb. 6, Feb. 10, Mar. 24, Apr. 18-21
Statewide Rankings (since 1895): 34th-warmest, 22nd-wettest winter, including the 8th-wettest February
How it Compares to This Year: We expect this year’s polar patterns to evolve much like they did in 1982-83, with a strong polar vortex in December (aided by a positive QBO) but a weakening polar jet stream by mid-January as the effects of El Niño and above-normal October Siberian snowfall kick in. However, we don’t expect wintry conditions to last through late March or April. Such late season events are quite rare, and in 1983, they were the product of a sustained strong El Niño throughout the winter and a late-blooming negative NAO phase.
1987-88
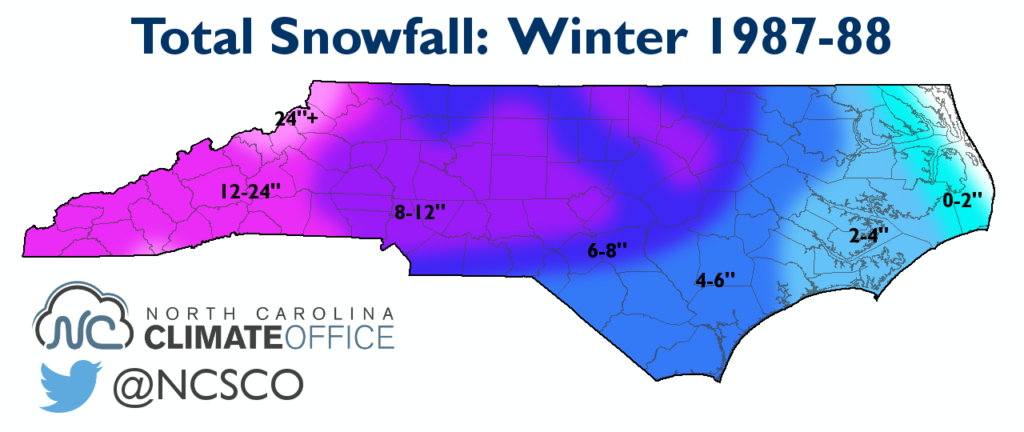
What Happened: A moderate El Niño peaked in the fall and weakened as the winter went on. A persistent positive-phase NAO meant limited snow chances for North Carolina, so our wintry weather was confined to one week in late December and early January, with an ice storm in the Piedmont and a mixed snow and sleet event across the Mountains and Piedmont.
Winter Storms: Dec. 29, Jan. 3, Jan. 7-8
Statewide Rankings (since 1895): 51st-coolest, 30th-driest winter, including the 8th-coolest January
How it Compares to This Year: Although we expect this year’s El Niño may peak slightly earlier than normal, the 1987-88 event was an extreme case. By the late winter, the El Niño was much weaker than when it reached its fall peak. This year’s event should remain stronger for longer. The 1987-88 winter also had little help from the polar jet stream, as below-normal October Siberian snowfall and a positive QBO phase contributed to a positive-phase NAO all winter.
1997-98
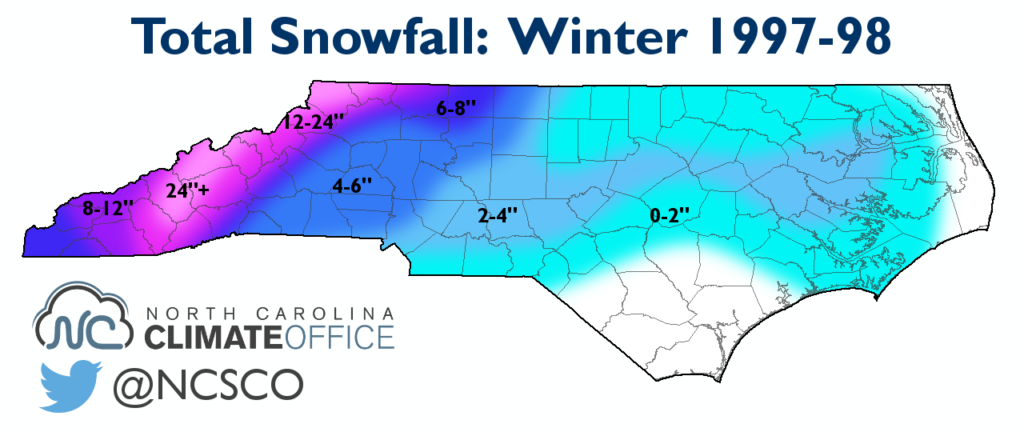
What Happened: The strongest El Niño event on record provided plenty of moisture to North Carolina, but the NAO switched to a positive phase by January, which effectively ended our chances of wintry weather. Western North Carolina saw back-to-back snow events in late December, and the Piedmont and Coastal Plain had just one minor snow event in mid-January, yielding below-normal wintertime snowfall across those regions.
Winter Storms: Dec. 29-30, Dec. 30-31, Jan. 19, Jan. 27-28
Statewide Rankings (since 1895): 39th-warmest, 1st-wettest winter, including the 1st-wettest January and 4th-wettest February
How it Compares to This Year: This year’s El Niño could rival that of 1997-98 and should have a similar peak timing in the late fall or early winter. However, the position of the 1997-98 El Nino in the eastern Pacific was not the most favorable for wintry weather in North Carolina. This year’s event is more of a central or basin-wide, rather than an east- or west-based El Niño. Near-normal Siberian snowfall in October 1997 also provided a less favorable setup for a weakening polar jet stream than we have this year.
Summary
The statewide rankings show that four of these five years had near- or above-normal precipitation. While not every year was snowier than normal, the average snowfall (right) paints a picture of an active wintry pattern, particularly along the coast thanks to an El Niño-strengthened subtropical jet stream.
The timing of these events is also interesting to consider. Of the 17 winter storms in these years, 12 occurred between December 29 and January 30.
This might not be surprising considering that January is climatologically our snowiest month. But as we discussed in our polar patterns post, it shows that favorable atmospheric conditions often set up during December and make January the month to begin watching for wintry weather.
That’s also reflected in the temperature rankings. Four of five years — all but 1997-98 — were warmer than normal in December but cooler than normal in January and February.
Overall winter temperatures were more of a mixed bag. Three of the five years were warmer than normal, and none finished with average temperatures more than 1.5 degrees below normal.
If we see similar conditions this year, that’s likely to mean a mix of warm and cool periods, but thanks to an active southerly jet stream, those cool periods could be susceptible to multiple bouts of wintry weather.