This is the final post of 2015 in our year-long series about North Carolina’s weather extremes.
Every month this year, we have covered some of North Carolina’s weather records from hot to cold, wet to dry, and fire to ice. These records describe a state with a wide variety of weather conditions and plenty of stories to tell about them.
Take our temperature extremes, for instance. On “the Coldest Day” — January 21, 1985 — temperatures plummeted well below zero across the state, including the statewide record of -34°F on Mount Mitchell. Exactly 17 months before that on August 21, 1983, record high temperatures were set across the state, with Fayetteville reaching 110°F.
This high temperature extreme has an interesting backstory that played out even as we researched it this year. Here’s the previously untold story behind this extreme.
A Cold Case About a Hot Day
At the Fayetteville Airport site where the apparent record occurred, the highest hourly temperature reading was only 109°F — certainly hot, but only enough to tie North Carolina’s long-standing record from Stanly County in 1940. However, it was later announced that the daily high had, in fact, reached 110°F in Fayetteville. This number found its way into the record books and our website, accompanied by a note that it was confirmed in a public statement more than 25 years ago.
As we started researching this record, we wanted to track down this statement or any other proof that it actually hit 110°F that day in Fayetteville. Aided by the National Weather Service in Raleigh, an initial search of old documents, electronic storage space, and a few online archives turned up nothing.
By this point, the blog post was ready to publish, so we sent it out with the best explanation we had: At some point, it was found that the Fayetteville Airport hit 110°F, although we still didn’t know when or how that was determined.
Not willing to leave it at that, we then consulted with the NOAA National Centers for Environmental Information, based in Asheville. Their website features a list of statewide extremes, and at some point in the past 10 years, we had to submit documentation of North Carolina’s records. However, our email archives didn’t go back far enough to include what we had submitted.
Finally, an email to NCEI brought the answer we’d hoped for. Dr. Karsten Shein and Tamara Houston found the hand-written observations from Fayetteville on that date and sent along a copy. In the “Remarks” column for the 7 pm — midnight GMT — observation, there was a note of “110°”.
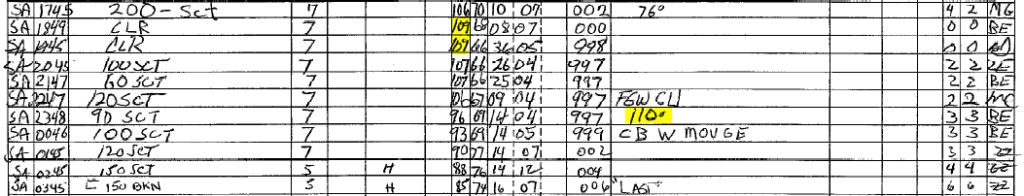
It turns out that every six hours, these sites reported the recent low and high temperatures. Modern airport-based stations do this as well, but it’s included with the electronic METAR reports. In 1983, it was only reported on the manually recorded surface observations document.
Our colleagues at NCEI also sent along reports from nearby Dunn, where it reached 108°F. This helped confirm that conditions really did support record heat across the Sandhills on that day, and we finally have the official observations to prove it.
Blowing Away the Records
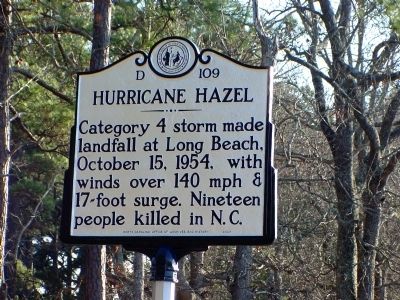
Of course, that’s not the only record shrouded with some uncertainty. In our post about the strongest hurricanes to affect North Carolina, one storm was conspicuously absent from the lists of lowest pressures and highest wind speeds. We received tweets saying “where’s Hazel?”, referring to the 1954 hurricane that, to this day, is the only Category-4 storm to make landfall in North Carolina. Here’s why Hazel was missing from those lists.
Hurricane Hazel made landfall on the morning of October 15, 1954, along the North Carolina/South Carolina border. Its eye was 20 to 30 miles wide, stretching as far east as Long Beach on Oak Island. But despite this fairly wide swath of land covered by the eye, few observing stations were within that path.
Forty miles away in Wilmington, the pressure dropped to 971.1 millibars. On the west side of the eye in Myrtle Beach, the minimum pressure was 964 millibars. Both are impressive numbers for a hurricane, but a far cry from the 937-millibar intensity estimated when Hazel was just off the coast.
The best estimate of Hazel’s true minimum pressure at landfall came from a well-placed fishing boat docked near Tilghman Point in the Little River of South Carolina. As the center of the eye passed over around 10:30 am, a barometer on the boat measured a pressure of 937.9 millibars. But because the instrument was unofficial — and in South Carolina — it kept Hazel off the list of lowest confirmed pressure readings in North Carolina.
Likewise, Hazel’s highest wind speeds struck between the observing stations in Wilmington and Myrtle Beach, where gusts of up to 98 mph and 106 mph, respectively, were reported. Even after Hazel moved well inland, Fayetteville received 110-mph gusts and Raleigh reported gusts of 90 mph, so there’s no doubt that it was a much more intense storm at landfall than these numbers suggest.
The best guess of Hazel’s peak winds came from Oak Island, where 140 mph gusts were estimated. Of course, any sensors in Hazel’s path might not have survived such strong gusts. In other highly ranking storms on our list, anemometers were broken or blown away once wind speeds reached much above 130 mph.
Despite the lack of official evidence of Hazel’s low pressure or high winds, it’s certainly one of the worst hurricanes to hit North Carolina in recent history, as shown by its position on our lists of the costliest and deadliest storms.
The Worst Drought on Record?
Although sensors might not always withstand the extreme conditions in a hurricane, at least their measurements are comparable from one event to another. That’s not always the case with another extreme we covered: drought.
The 2007-08 drought was one of the most recent extremes we discussed, so memories of it are fresh on the minds of many in North Carolina. As water supplies dwindled — just 38 days of water were left in Durham’s primary reservoir, at one point — the potential consequences of the drought became quite serious.
As the impacts worsened, behind the scenes at the State Climate Office, we spent time researching whether that drought was our worst on record. Measuring drought isn’t always straightforward since it happens over different time periods and spatial distances, often with localized impacts.
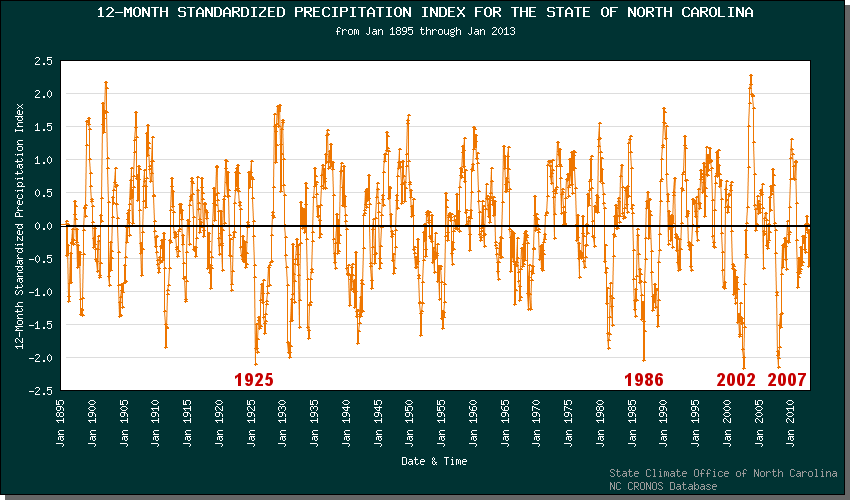
Many different drought indices have been developed to quantify these impacts based on observed precipitation and temperature data. While most of them showed the 2007-08 drought as one of the most intense, they all disagreed about which was the worst.
Shorter-term indicators — often used in the Southeast US, where multi-year droughts are rare — pointed to the 1925-26 or 1985-86 droughts as the worst. Longer-term drought indices showed the 2001-02 and 2007-08 droughts as the worst. So which is really North Carolina’s worst drought on record?
The nature of drought makes that a tough question to answer because drought goes beyond the weather itself. Population growth from 1925 to 2007 might have increased our vulnerability to drought impacts, but the construction of reservoirs in that time also increased our capacity to manage for droughts.
The US Drought Monitor accounts for both the recent weather and local impacts, and in its short history since 1999, the 2007-08 drought ranks as the worst and most widespread, with 66% of North Carolina in Exceptional Drought (D4) conditions in December 2007. Chances are that if Drought Monitor maps had been produced in 1925 or 1986, they would’ve looked quite similar, and either could make a case of being the worst drought somewhere in the state.
Closing Thoughts
While the range of extremes we covered was broad, they all had at least one thing in common: It took an exceptional set of ingredients to make them happen. In most cases, there was cooperation between the upper levels and low levels of the atmosphere, like in the April 2011 tornado outbreak, the December 2002 ice storm, or our record high pressure events.
Many events also had perfect timing for extreme impacts, such as the “Storm of the Century” in March 1993 that brought 50 inches of snow to Mount Mitchell. Perfect positioning was important too, like when winds from a landfalling hurricane blew up the mountain slopes in July 1916, resulting in record rainfall and flooding.
Some extreme events even overlapped. Droughts in 1955, 1985, and 2008 set the stage for ideal fire conditions and some of our largest wildfires. And as the 2007-08 drought began to emerge during a warm spring, a late-season cold snap brought a damaging Easter weekend freeze.
Every region of North Carolina, and almost every type of weather you could imagine, was represented in our look at NC Extremes. And the events we covered only scratch the surface of our state’s interesting weather history, so we will continue looking at more extreme and unusual events next year.
If you have any feedback on this series or suggestions for other posts, please tweet them to us @NCSCO or contact us by email or phone.
On behalf of our entire office, we wish you a very happy holidays and we look forward to bringing you more blogs next year!