Following a snow-free year in many areas and with drought now gripping more than half of the state, a pattern change – both from what we’ve seen in recent winters and in recent weeks – would be welcome.
So could the newly emerging El Niño be the answer? In our twelfth annual winter outlook, we’ll have a closer look at this year’s El Niño, some statistics among similar historical years, and our expectations for the winter ahead.
For the bottom line up front, here are some key takeaways from this year’s outlook:
- An El Niño pattern is currently in place, and is expected to remain through the coming winter, although we haven’t felt its impacts locally just yet
- Thanks to an active jet stream to our south and southeast, most historical El Niño events have been wetter than normal in North Carolina
- Our temperatures and snowfall will depend on the strength of this El Niño, along with other atmospheric patterns that can open the gates to cold air from the north
El Niño is Back
We spent the past three winters in a La Niña pattern, which favors warm and dry weather for North Carolina. While the first of those events in 2020-21 was unusually wet with few signs of La Niña’s typical atmospheric impacts in our region, that was followed by more typical La Niña winters in 2021-22 and 2022-23.
But that once-unflinching La Niña faded fast this spring, clearing the way for the opposite end of ENSO: its namesake El Niño phase, characterized by warmer water in the equatorial Pacific Ocean and the atmospheric changes it induces.
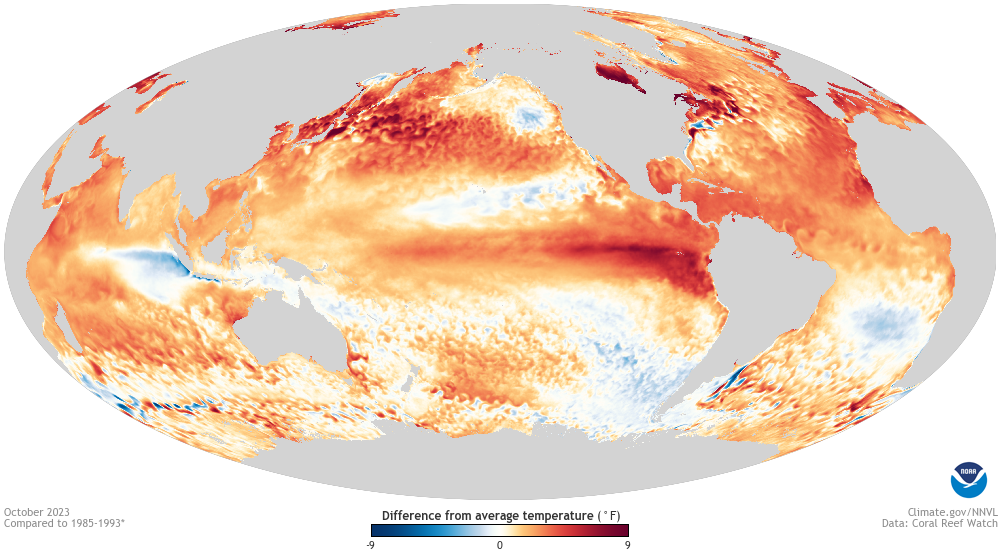
This El Niño has been gaining strength all summer, with sea surface temperature anomalies over the past three months sitting at 1.5°C above average according to the Oceanic Nino Index, and 1.6°C above average in the so-called Nino 3.4 region – defined by a particular bounding box in the central Pacific that tends to best reflect changes in the tropical atmosphere.
That means a moderate to strong El Niño is already in place, with a classic “tongue” of warmer water extending from the west coast of South America across the Pacific.
The ocean is only half the story, though. ENSO is a coupled system between the ocean and atmosphere, particularly with wind patterns that extend around the world. And at least over the Pacific, NOAA’s ENSO Blog notes that the large-scale circulations, including the easterly trade winds, have been weakening, as is typical in an El Niño event.
One wrinkle is that some indicators don’t show such a strong atmospheric signal at the moment. The Multivariate ENSO Index, or MEI – which considers not just sea surface temperatures, but also air pressure, winds, and radiation changes across the Pacific – came in at just +0.6 (barely above the El Niño threshold of +0.5) in August and September, and actually decreased to +0.3 for the two-month period in September and October.
The large-scale wind and weather patterns extending beyond the Pacific and over North America also have yet to fully take shape. One way of viewing this is via the upper-level velocity potential. Simply put, it shows areas of convergence (or sinking air aloft, often associated with surface-level high pressure) and divergence (or rising air aloft, and commonly surface-level low pressure).
Entering our last strong El Niño winter in 2015-16, much of the continental United States was beneath a broad area of divergence, which certainly matches our weather pattern from that time. October 2015 was wet for most of North Carolina, and that wet pattern continued into the winter that followed.
This October, the eastern US was under an area of convergence, matching our observed dry weather pattern. While that doesn’t mean such a pattern will last through the winter, it does at least confirm that we haven’t seen El Niño’s expected local impacts just yet.
El Niño, By the Numbers
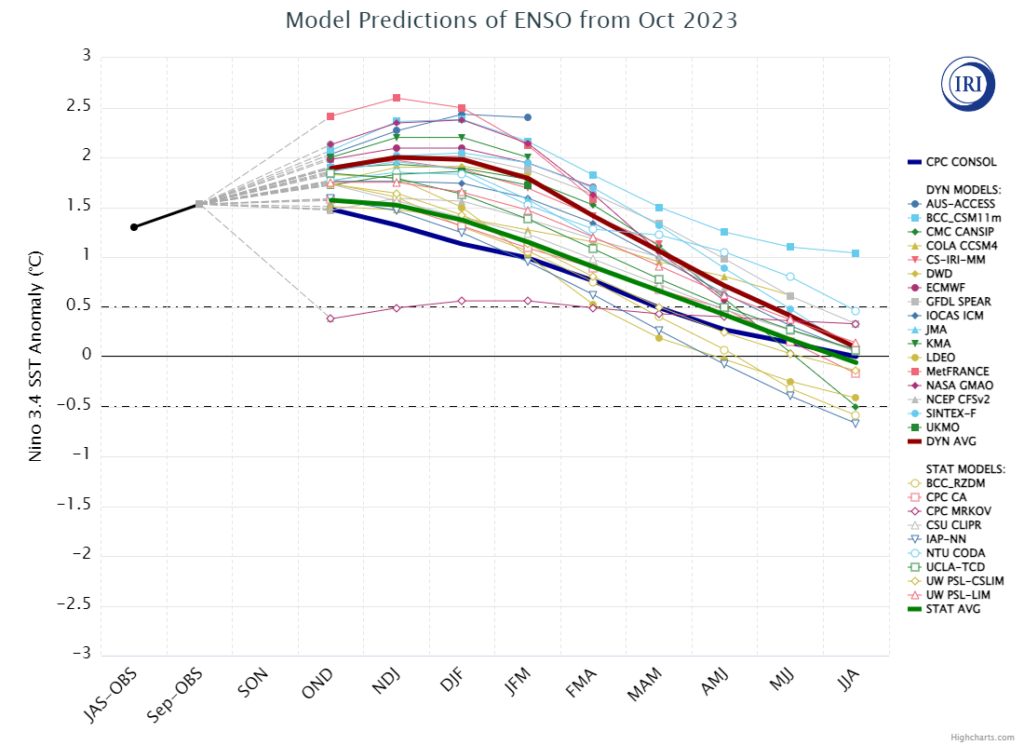
At the moment, most forecast models are showing a wintertime Nino 3.4 sea surface temperature anomaly of between 1.0°C and 2.5°C above normal, which would keep this event in the moderate to strong range. For comparison, the 2015-16 event was at the upper end of this range at 2.4°C above normal, and our last El Niño in 2018-19 was weaker, with an average Nino 3.4 anomaly of 0.7°C.
Accurate records of historical ENSO events begin in 1950, and in the 74 winters since then, 25 have reached the El Niño threshold per the ONI. Of those, 12 were in the same moderate to strong range we’re expecting this year.
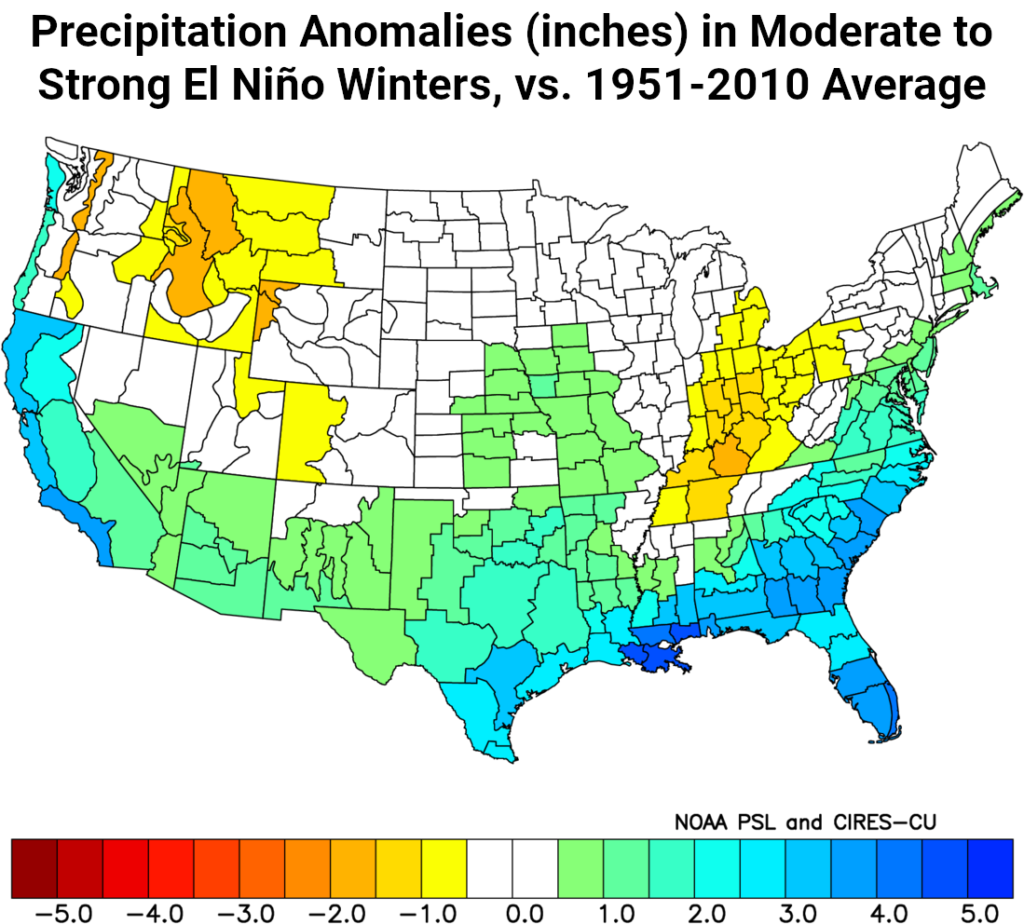
On average across those dozen winters, we can see El Niño’s signature wetter-than-normal conditions along the Gulf of Mexico and up the east coast through the mid-Atlantic, including in North Carolina.
That tends to happen because a strong subtropical jet stream anchored to our south carries weather systems through the Gulf and up our coastline, where they pick up moisture and drop it as precipitation across our region.
Statewide, in these past moderate to strong El Niño events, 9 of the 12 were wetter than normal for the climatological winter, from December through February. Each of the past three such winters – in 1997-98, 2009-10, and 2015-16 – ranks among our top ten wettest on record. All of that gives us fairly high confidence in having wetter weather during an El Niño winter.
On a month-by-month basis, November was also wetter than average 9 of 12 times, December and January were each wetter in 7 cases, and 10 of 12 Februarys were on the wet side. But if we’re still awaiting drought-relieving rains by March, then El Niño is no guarantee of that. Just 5 of the 12 moderate to strong El Niño winters were followed by a wet March.
In terms of temperatures, we often used to say that El Niños tend to be both wetter and cooler for North Carolina, but that has not been the case in recent years. While 5 of the 7 El Niño events prior to 1990 were cooler than the 20th-century average, the five events since then have each been warmer than average, including our 10th-warmest winter on record in 2015-16.
Climate change is one cause, since winter is when we’ve seen the most pronounced warming trend, as the North Carolina Climate Science Report notes. In addition, during recent strong El Niños in 1997-98 and 2015-16, the supercharged jet stream has pumped in almost-tropical air at times and prevented any sustained blasts of cold air from setting up this far south.
That 2015-16 winter began with our warmest December on record, and only 3 of the 12 moderate to strong El Niño winters have been cooler in December. However, January and February were each cooler than average in nine of those years, which offers some hope of an eventual cooldown this season.
| Month/Season | Times Wetter Than Average | Times Cooler Than Average |
|---|---|---|
| November | 9 of 12 | 3 of 12 |
| December | 7 of 12 | 3 of 12 |
| January | 7 of 12 | 9 of 12 |
| February | 10 of 12 | 9 of 12 |
| March | 5 of 12 | 5 of 12 |
| Winter (DJF) | 9 of 12 | 5 of 12 |
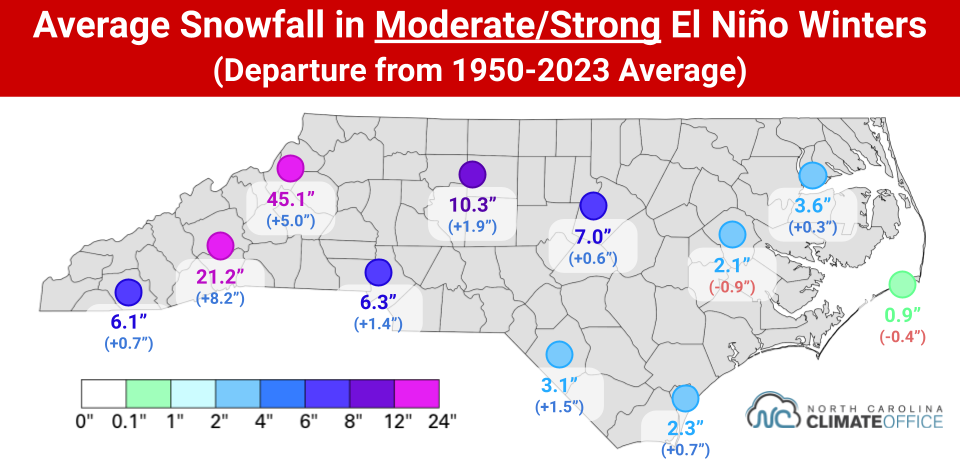
While warming temperatures have cut down on our average snowfall, El Niño events generally remain one of our best opportunities for wintry weather thanks to the storm systems that frequent our state.
In moderate to strong El Niño winters like we’re expecting this year, we’ve seen above-average snowfall in most areas, including 10.3 inches in Greensboro (vs. an average of 8.4 inches), 6.3 inches in Charlotte (vs. 4.9 inches) and 7.0 inches in Raleigh (vs. 6.4 inches).
Take note, though, that snow is rarely a safe bet especially the farther east you go, and more than half of the moderate to strong El Niño winters have had below-average snowfall across the Coastal Plain, offset by a few years with sizable accumulations.
Finally, a look at these past winters shows that a stronger El Niño tends to have more pronounced impacts in North Carolina. During the six strongest events – with a wintertime ONI greater than 1.5 – we averaged half an inch more precipitation, as compared against all moderate to strong events.
In those strongest El Niño winters, our average temperatures were also more than a degree warmer, and accordingly, we’ve seen a reduction in snowfall across the Mountains and Piedmont. So if this year’s El Niño is on the stronger side, then that could spell better news for drought relief, but perhaps worse odds of snow.
Our Winter Outlook
Based on the current average of ENSO forecast models, we expect a relatively strong El Niño event in place this winter, with the ONI and Nino 3.4 anomalies peaking at about 2.0°C.
However, we don’t expect the immediate arrival of El Niño’s typical impacts. Given our recent dryness and the slower emergence of an El Niño-like jet stream pattern over North America this fall, it may take a bit more time before wetter weather kicks in.
That was the case in 1965-66, when we slipped into a fall drought that developed under a similar pattern of upper-level convergence and surface high pressure over the eastern US. By that November, the state Secretary of Agriculture declared a drought emergency in parts of the Mountains while wildfire activity picked up at the coast. However, by the middle of January in 1966, the winter had arrived, to the relief of drought-weary farmers and children eager to play in the snow.
We likewise expect an eventual shift to wetter-than-normal conditions in January or February – if not both. This matches the historical odds during moderate to strong El Niño winters. Only one of those events, in 1991-92, had all three winter months finish with below-average precipitation statewide, and in that case, each month was within an inch of the long-term average.
With that said, we don’t expect a totally clear drought map by the end of winter. Given the current seasonal precipitation deficits of 5 to 10 inches, it would take an almost historically wet winter to fully overcome those in just three months.
For instance, Wilmington is 9.76 inches below normal so far this fall, and only two times – during the strong El Niños of 1982-83 and 1997-98 – has the Port City finished winter more than 10 inches above normal.
Fortunately, even average precipitation this winter could still make a dent in the drought and the impacts we’re currently feeling, particularly tamping down the wildfire activity and boosting reservoir levels and groundwater storage.
Our overall winter temperatures may hinge on how strong this El Niño ends up getting, with a stronger event making warmer-than-normal weather more likely. Consistent with NOAA’s winter outlook, which gives most of North Carolina slightly elevated odds of being warmer than normal, we expect near- to above-normal temperatures on average this winter, but with the potential for at least brief cooler stretches by January or February.
If that happens, then it may be because of help from large-scale patterns besides ENSO that can also shape our weather. While they’re tough to predict this far ahead of time, it’s worth watching for a potentially weakening polar vortex or high pressure parked to our north in a classic “cold air damming” setup, since both of those could send shots of chilly air in our direction.
And yes, a timely combination of cold air and moisture, with just the right amounts of each, could mean frozen precipitation. The historical odds favor at least one measurable snowfall for most of the state this winter. Among the 12 moderate to strong El Niño events, only once has central and eastern North Carolina gone the entire season without snow. That happened in 1991-92, which was also a below-average year in the Mountains, with only 2.5 inches in Asheville.
Of course, whether we meet or exceed our normal snowfall often comes down to whether we get one or two big events. That was the case during our last El Niño winter in 2018, which started with a significant winter storm in early December that brought more than a foot of snow to parts of the Mountains and northern Piedmont.
After that, we saw little to no snow for the remainder of the winter, but many areas still finished above average thanks to that one event. That was also the last 6”+ snow event for parts of the Piedmont, while there has been an even longer wait for areas farther south and east.
Whether it’s frozen or liquid, any precipitation would help at this point, so whether you dream of a White Christmas or a wet one, let’s hope this winter – and the El Niño pattern that is usually one of our most reliable bets for wet weather – delivers much moisture in any form.