After sliding through this June and July with relatively few hot days, it may have seemed like we were out of the woods when it came to summer’s highest heat. But then came August and hundred-degree temperatures in the eastern Piedmont and Sandhills.
Existing datasets tell us that our hottest weather typically occurs in July, so how rare is it to hit our maximum mercury levels in August? Or even later?
Using historical observations from 65 weather stations in the National Weather Service’s Cooperative Observer network with at least 30 years of data, we calculated not only when the hottest temperatures most commonly occur (spoiler: it’s still July), but also how early and late in the year they’ve historically happened.
The results show interesting variability in the Mountains, a seasonal spike in the Piedmont, the ocean’s effects on the Coastal Plain, plus some recent extremes in our annual extreme temperatures.
The Mountains (Mostly) Beat the Heat
It’s no secret that elevation is a salvation when it comes to avoiding the heat, but it may still surprise you to know how much cooler the Mountains tend to be, even on their hottest days.
Of the 21 long-term stations in the Mountains, only 10 have ever measured temperatures of 100°F or greater. In their records covering the past 40 years, Mount Mitchell’s maximum temperature is just 81°F, and Boone has only ever reached 93°F.
The graph below of the hottest temperature occurrence in Boone offers several insights into its cooler climate. About a third of the time, the hottest annual temperature there never even reaches 85°F. And the hottest days there exceeding 90°F are historically confined to only July and August.

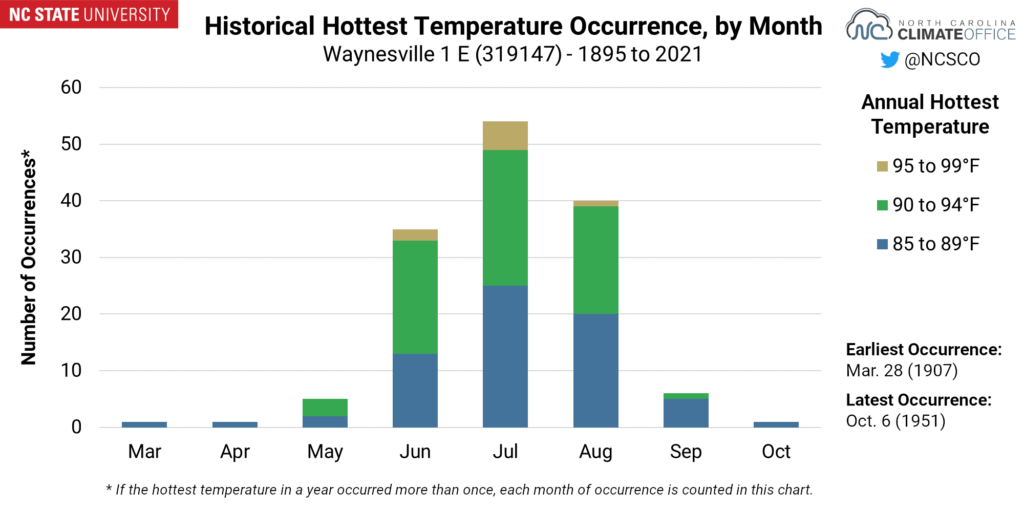
Some mountain sites have greater variability for when their hottest annual temperatures have occurred. In fact, the widest range in the entire state between the earliest and latest occurrence of the hottest temperature belongs to Waynesville.
On March 28, 1907, the temperature spiked to 89°F, which is the warmest it would get all year there. That April included a chilly stretch with highs in the 40s, and the summer that followed was quite seasonable. Temperatures reached the mid-80s throughout July, but never exceeded that unusually warm day in March.
On the other extreme, an extended summer in 1951 saw highs in the 80s as late as October, including a maximum temperature of 88°F on October 6, which tied that year’s hottest temperature in Waynesville.
A Summer Pattern in the Piedmont
All 22 Piedmont stations we examined have all-time maximum temperatures of 103°F or greater, but in any given year, the heat is generally confined between June and August, which fits the definition of climatological summer.
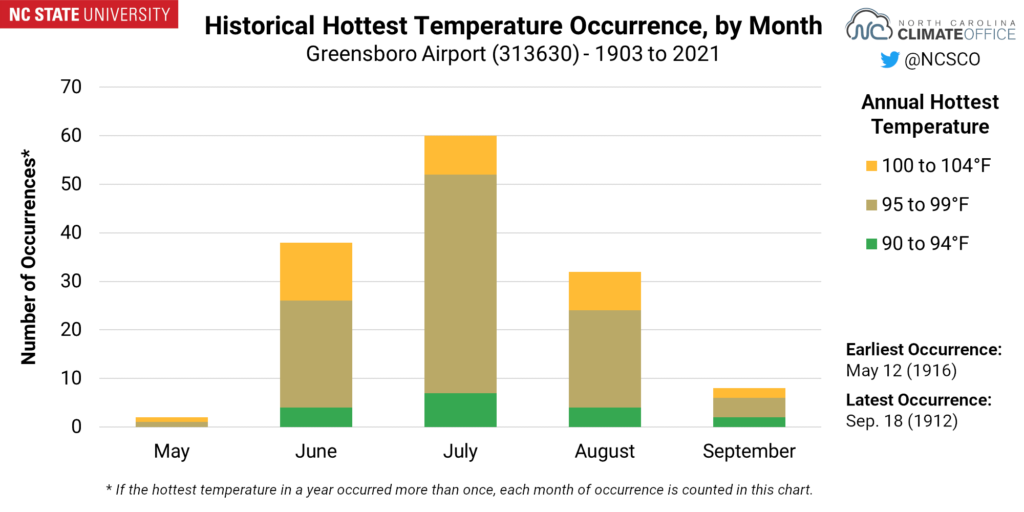
Greensboro is a good example. Out of the past 118 years, its historical hottest days all fall between May 12 and September 18, and they fit a fairly uniform distribution. The hottest weather there most commonly occurs in July, with nearly even numbers of annual hot days in June and August, and much fewer in May and September.
However, when June in the Triad is hot, it tends to be very hot. Of the 38 times when the hottest day in a year has occurred in June, it has reached 100°F or greater a dozen times.
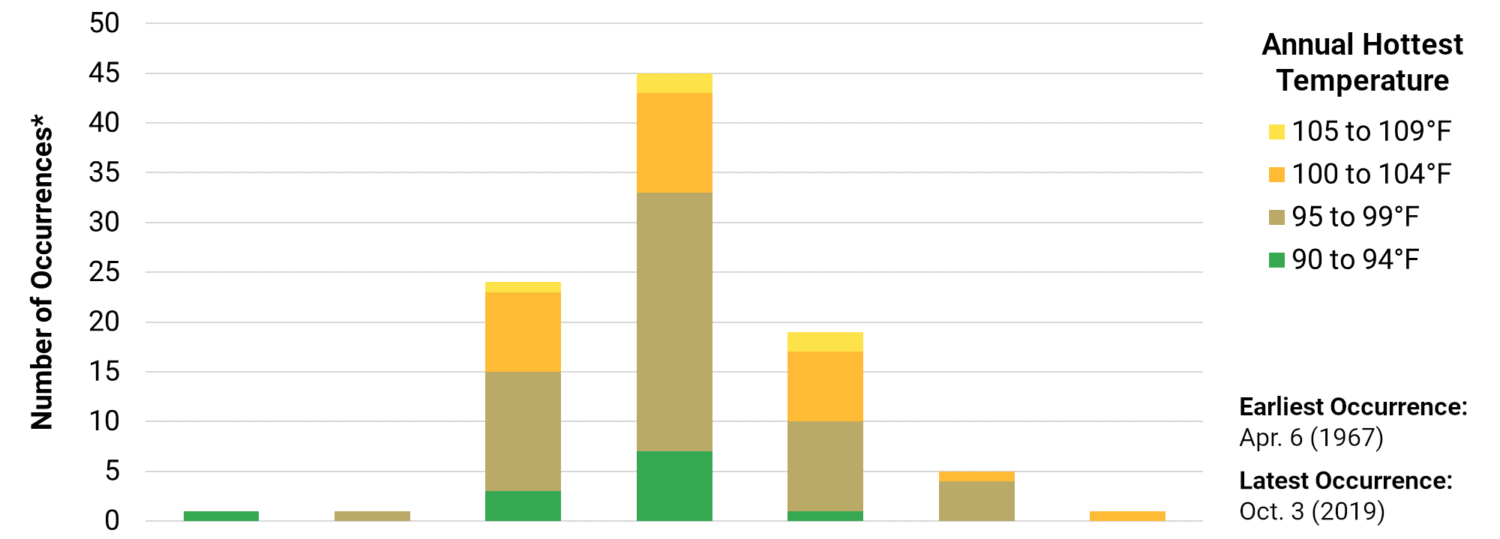
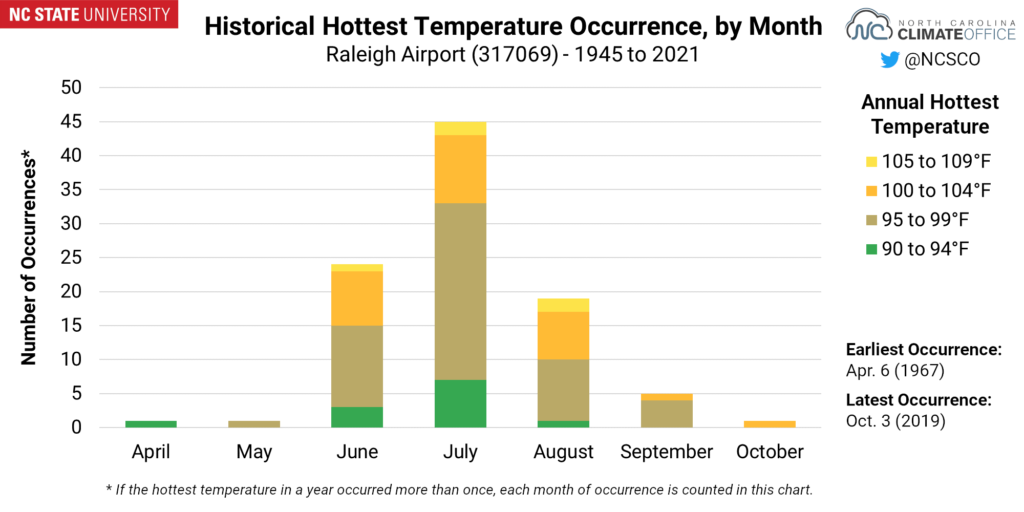
Some Piedmont sites do spread beyond that tidy seasonal distribution. Raleigh has the greatest variability across the region, with its hottest days occupying a nearly six-month stretch from April 6 (in 1967) to October 3 (in 2019).
While July is also the most common month for the hottest temperatures in Raleigh, it’s worth noting that the warmest temperature on record there, 105°F, has happened six times — twice each in June, July, and August.
In addition, the statewide record high of 110°F happened in Fayetteville on August 21, 1983 — unusually late in the season for such hot weather.
The Ocean in Control at the Coast
The nearby Atlantic Ocean offers several restrictions on extreme heat for sites across the Coastal Plain, and nowhere is that more obvious than a site surrounded on all sides by water.
At Cape Hatteras, the ocean’s moderating influence is strong. The warmest temperature on record there is just 96°F, making it the only long-term site in eastern North Carolina that hasn’t hit triple digits.
Also, the historical hottest days at Hatteras have happened in just four months of the year, from June through September. Any earlier or later, the ocean is generally too cool for the air swirling above it to surge to sweltering heights.
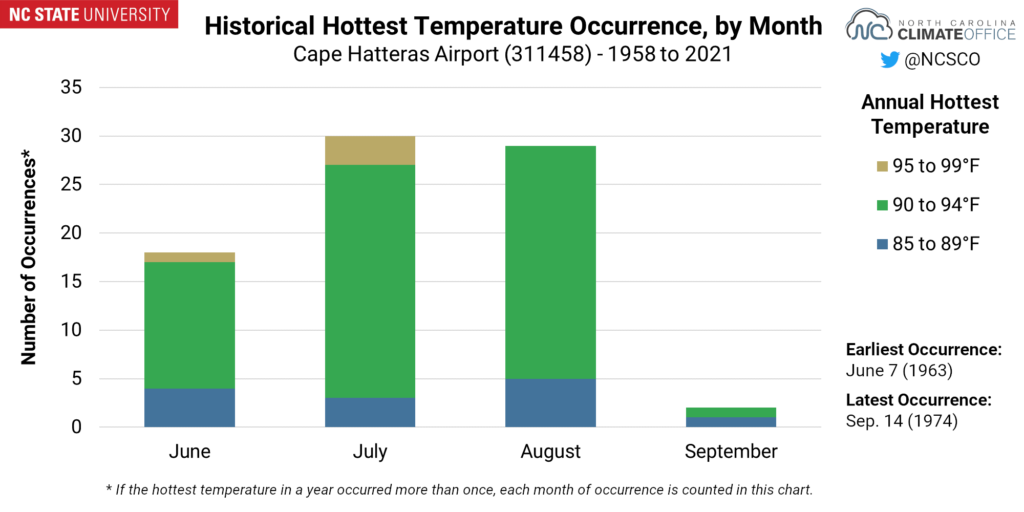
However, because of the higher heat capacity of water compared to air — think of the ocean as a large battery that takes longer to recharge — it doesn’t hit its warmest levels until later in the summer. It’s why a swim on Labor Day tends to be more comfortable than one on Memorial Day. That also makes hot days in August nearly as likely as those in July along the Outer Banks.
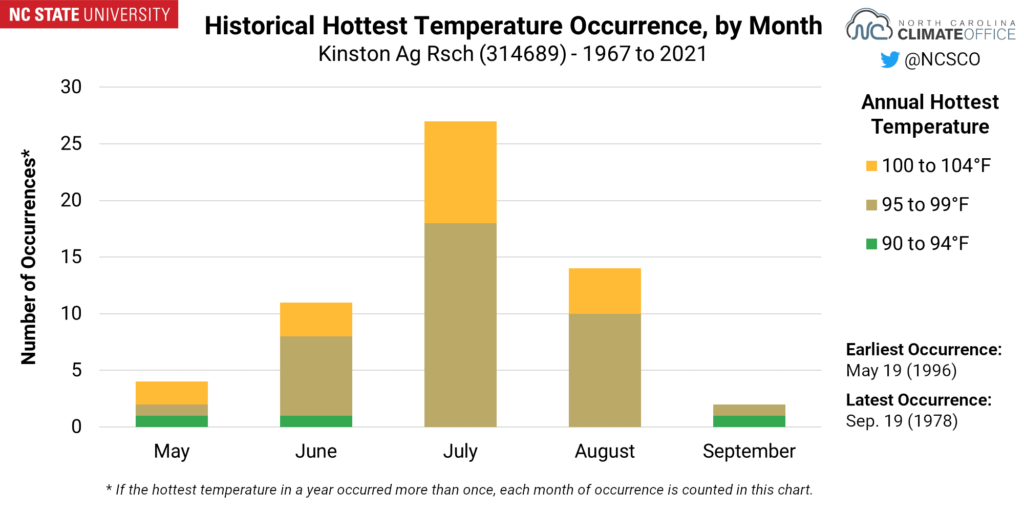
Farther inland, that ocean influence is also apparent, but less drastic. In Kinston, the annual hottest days are still more likely in August than in June, but the range of occurrence opens up to a four-month window spanning five calendar months, from May 19 (in 1996) to September 19 (in 1978). Extreme temperatures are also warmer here, reaching up to 103°F in its historical observations.
Recent Records, and Their Impacts
So far, 2021 hasn’t proven to be as extreme of a year in terms of temperatures, but a cooler start to summer giving way to surging heat in August has left this year’s hottest temperatures occurring a bit later than the historical average.
For two coastal sites, that combination gave them their latest-occurring hottest temperatures at the end of last month. Cedar Island hit 96°F on August 30 and Bayboro reached 93°F on August 31, which set or tied the hottest day so far this year at both sites.
Among other locations, one year clearly dominates the latest occurrences of the hottest annual temperatures. Out of the 65 stations in this analysis, 26 of them — or 40% — had the latest occurrence of their hottest temperature in 2019. That period from late September through early October two years ago saw little rainfall, hot weather, and rapidly emerging drought across central and western North Carolina.
In a changing climate, summer-like heat is expected to extend into the fall more frequently, and 2019 offered plenty of examples of the impacts that can have on our state. Among them, that “flash drought” quickly sapped soil moisture levels, and the heat effectively roasted crops in the field just before harvest.
For outdoor workers — along with athletes practicing and playing fall sports like football — being exposed to heat for longer in the year adds additional stress on their bodies. The same is true for people without access to air conditioning, and even for those with that luxury, prolonged heat can make it costlier.
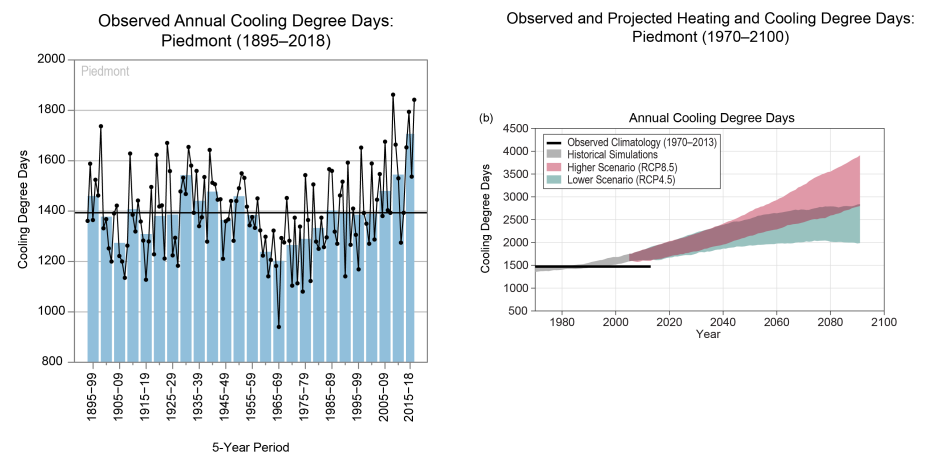
RIGHT: Projected future changes in cooling degree days for the Piedmont.
(From the North Carolina Climate Science Report, Figures 3.27 and 3.28.)
A commonly used indicator for summertime energy demand is cooling degree days, and it’s directly related to ambient temperatures. Over the past 50 years, the number of cooling degree days has been trending upward, and our annual totals are projected to nearly double by the end of the century.
That’s being driven both by warmer nighttime low temperatures, along with hotter weather becoming more common in our “shoulder seasons” of the spring and fall.
That means this climate curiosity of when our hottest temperatures occur has some very real consequences, and those impacts are changing more than just the statistics about our climate in North Carolina.