September saw a timely change of seasons and mostly dry weather, apart from Ophelia. That tropical storm was part of an active month across the Atlantic.
From Summer into Fall
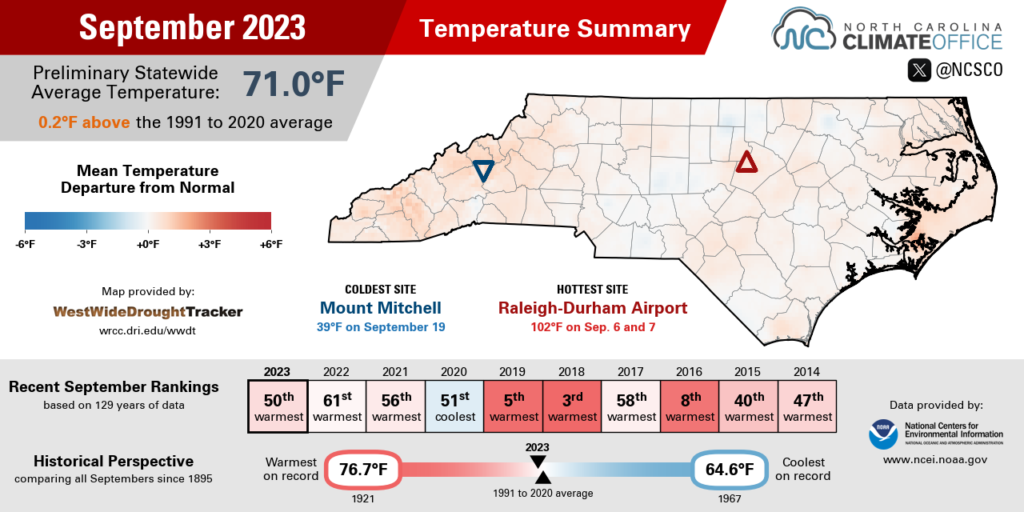
Sweltering heat gave way to more seasonable conditions in September, so it averaged out as a slightly warmer than normal month overall. The National Centers for Environmental Information (NCEI) reports a preliminary statewide average temperature of 71.0°F and our 50th-warmest September since 1895.
The month started where August left off, with extreme heat across much of the state. With high pressure blanketing the Carolinas, our temperatures rose well into the 90s during the first week of the month, peaking on September 6.
On that date, Raleigh reached 102°F, then equaled that mark on the following day, making it the first September on record there with multiple days exceeding 100 degrees. Our ECONet station in Durham topped out at 100°F, and even Roxboro – whose northerly location and higher elevation typically makes it one of the cooler spots in the Piedmont – reached 97°F, which was its first day that warm since October 2019.
We got a brief break from the heat when a cold front moved through on September 9, but summer made one last push the following week, with temperatures again hitting the upper 80s to low 90s by September 12.
After that, a series of regular frontal passages and cooler high pressure systems to our north kept the heat from building back, and instead left us cooler and less humid, just as we’d expect from the fall.
We even had our first nippy mornings of the season, including on September 19, when low temperatures dipped into the 40s in the Mountains and rural parts of the Piedmont.
Barring an October heat wave, we’ve seen our final 90-degree days this year, and for the second year in a row, the arrival of fall-like weather happened right on time, both by the calendar and our climatology.
Greensboro last hit 90 degrees on September 7, compared to a historical average final 90-degree day of September 10. Raleigh’s last 90°+ reading on September 12 matched its historical average occurrence. And New Bern and Wilmington, which also hit 90°F on September 12, saw that milestone within 3 to 4 days of the historical average.
In Siler City, the first night below 50 degrees – a crisp 46°F on September 16 – happened just one day earlier than its average so far this century.
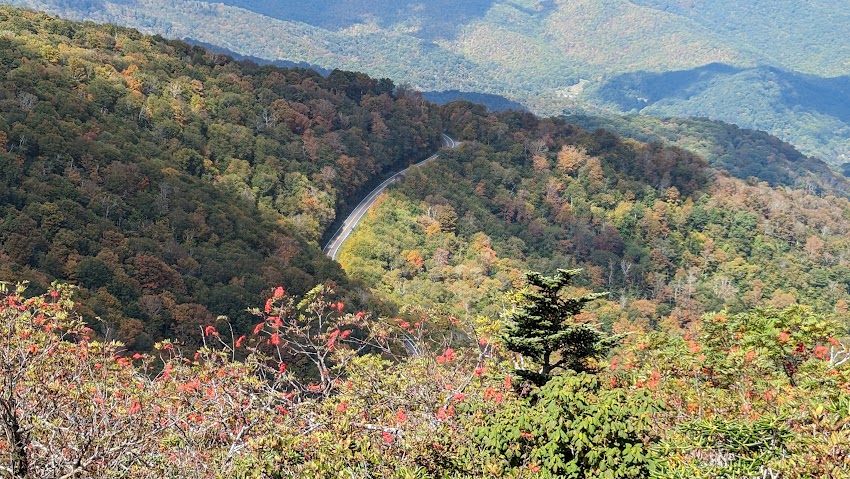
Cool, clear nights like that should help make this another good year for fall colors. Dr. Howard Neufeld, a professor of biology at Appalachian State University, recently noted on his Fall Color Guy page that the color change is well underway above 4,000 feet, and the changing leaves are complemented this year by the bright red berries on mountain ash trees.
Considering the sunny weather in the forecast and more cool nights likely beginning this weekend – both of which are key triggers for trees to produce their colorful pigments – Dr. Neufeld expects this year’s color change to proceed roughly in line with the typical timing, which means peak color from mid- to late October in the Mountains, progressing eastward into the Piedmont by early November.
Dryness Shifts Westward
Much of the state was drier than normal in September, but some coastal areas picked up heavy rain from Tropical Storm Ophelia. According to NCEI, the preliminary statewide average precipitation was 3.56 inches, which ranks as our 52nd-driest September out of the past 129 years.
Particularly across the Mountains and Foothills, rainy days were rare last month. Asheville had only five days with measurable rainfall and only one with at least a half-inch of rain during the frontal passage on Sunday, September 10.
It finished the month with 1.66 inches total, or 2.10 inches below average, in their 17th-driest September out of the past 72 years. Hickory matched that ranking with 1.83 inches, or 2.20 inches below average.
Shelby was even drier, with only 0.62 inches all month and its 9th-driest September out of 97 years with observations. Their last September as dry as this was in 2019, when a fall flash drought emerged across western North Carolina.
In the Piedmont, conditions ranged from very dry in Charlotte, which had only 0.88 inches and tied for its 19th-driest September since 1878; to near normal in Chapel Hill, which finished with 3.61 inches, within a half-inch of its average September rainfall; to slightly wet in both Greensboro and Raleigh, which had 5.38 and 5.48 inches, respectively, last month.
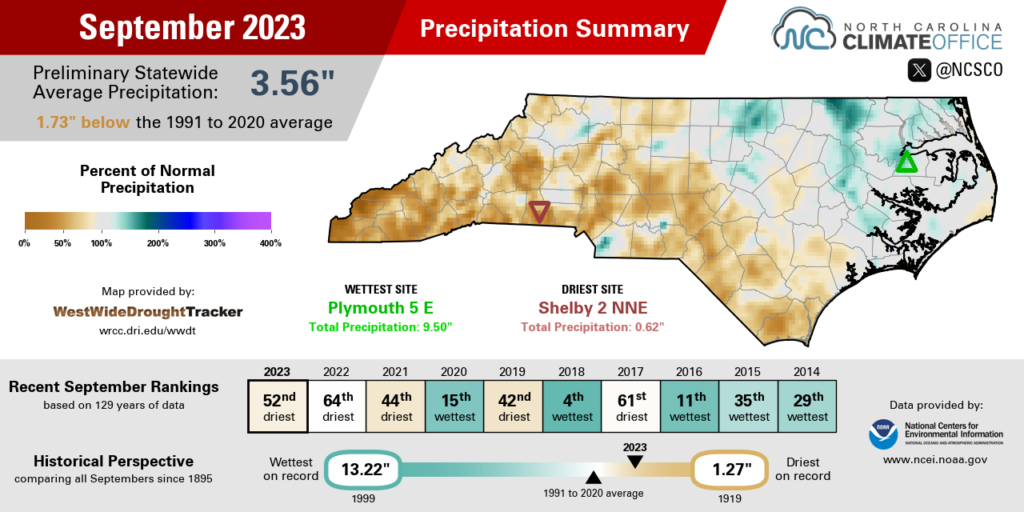
Precipitation was also highly varied across the Coastal Plain, largely depending on where the heaviest rain from Ophelia fell. Among the areas hit hardest by the storm, New Bern was an inch above normal in its 22nd-wettest September since 1948, and Roanoke Rapids was 2.75 inches above normal in its 10th-wettest September since 1972.
Farther south and west, it was considerably drier. Lumberton had only 1.93 inches all month, or just 42% of its monthly average, and Fayetteville had 2.22 inches in its driest September since 2013.
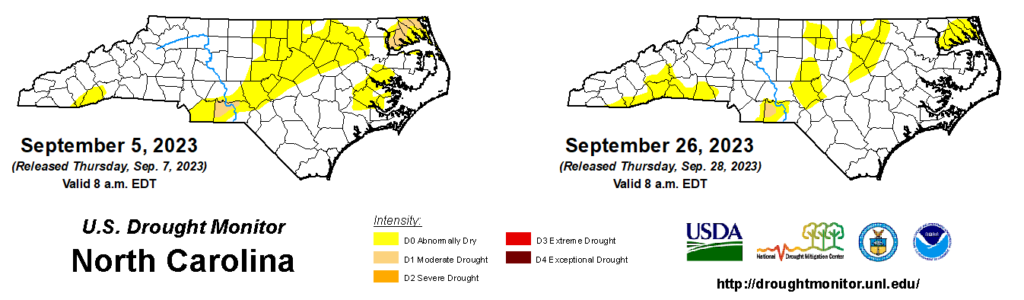
The good news from September is that Ophelia’s rain fell on many of our driest areas, so they finished the month with a net improvement on the US Drought Monitor. That included the removal of Moderate Drought (D1) in the northeast, where the summer-long drying trend finally slowed down.
While Elizabeth City was still slightly below normal for the month, and remains 8.21 inches below normal over the past six months, the rain from Ophelia helped groundwater levels jump by 1.5 feet in the greatest single-event increase since late April.
As dryness faded in the east, it emerged in the west, mainly in the southern Mountains, where streamflows fell below normal in September. If October remains dry – and current outlooks suggest it might – then those areas could see drought emergence similar to last year, when leaves on the trees were vibrant, but once fallen, they contributed to an uptick in fall wildfire activity.
An Active Atlantic
Last fall, a timely tropical storm – Nicole in mid-November – was the eventual answer to drought worries for much of western North Carolina. The same could be true this year, especially given the flurry of recent activity across the Atlantic.
That’s a big change from a month and a half ago, when the tropics were largely idle. After Hurricane Don dissipated in July, no storms formed in the first half of August, which made NOAA’s updated outlook calling for above-normal activity seem questionable.
But since then, the tropical Atlantic Ocean has remained historically warm, and the storms have indeed followed. The six storms forming in August included Idalia, which brought our first round of tropical rainfall this year.
September saw an additional seven storms form, plus the redevelopment of Gert over the central Atlantic. The strongest of them was Hurricane Lee, which briefly reached Category-5 status and eventually impacted Maritime Canada as a strong remnant storm.
Including storms that carried over from August, the ten named storms active during September tied for the most ever recorded in a single month in the Atlantic, along with September 2010 and September 2020.
Needless to say, those predictions for an active Atlantic season have already proven accurate, with 17 named storms plus an unnamed subtropical storm back in January, compared to the recent 30-year average of 14 tropical storms per season.
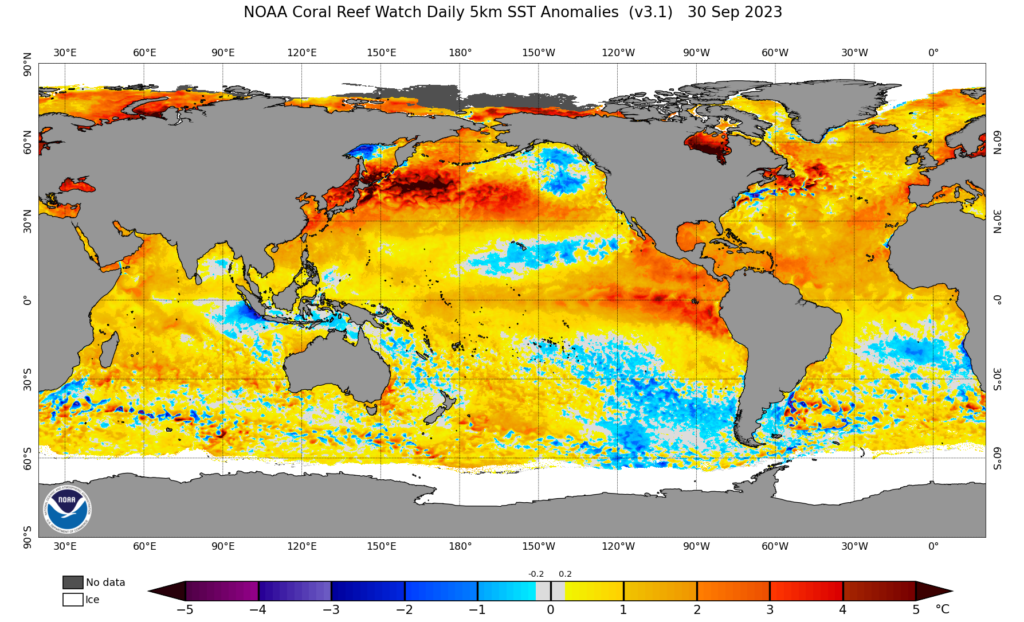
With sea surface temperatures across the basin still running up to 3 degrees above normal and two months left in the official hurricane season, we’ll likely add more storms to this year’s count, potentially even tapping into the supplemental list of storm names, which was changed from the Greek alphabet to more standard names after the record-breaking season in 2020.
And as for the El Niño, which we noted could limit Atlantic activity once stronger upper-level winds kicked in, it’s still emerging and looking like a moderate to strong event will be in place for the winter.
By late September, some strong upper-level winds were blowing across the Atlantic, but primarily north of the main development region between Africa and the Caribbean. That could become more of a barrier to tropical formation over the final months of the season, but tropical activity should also remain possible in the warm Gulf of Mexico.
And by the end of the fall, we still expect the typical El Niño-induced jet stream pattern bringing moisture-rich storms to our south and east to take shape, as CPC’s latest seasonal precipitation outlook suggests.
So while drought and its impacts are possible this fall, the active tropics and an expected robust jet stream by the winter could mean wetter weather on the horizon.