Shorter days and the emergence of pumpkin spice everything are sure signals that we’re entering the fall. In fact, meteorological fall began on September 1, but you wouldn’t have known it from the thermometer readings alone.
Indeed, North Carolina’s summer was perhaps best defined by the persistence of above-normal temperatures that stretched from June through early September. In this post, we’ll look back on the the summer conditions, including our temperatures and precipitation, and look ahead to what the fall weather may have in store.
A Scorching Summer, in Summary
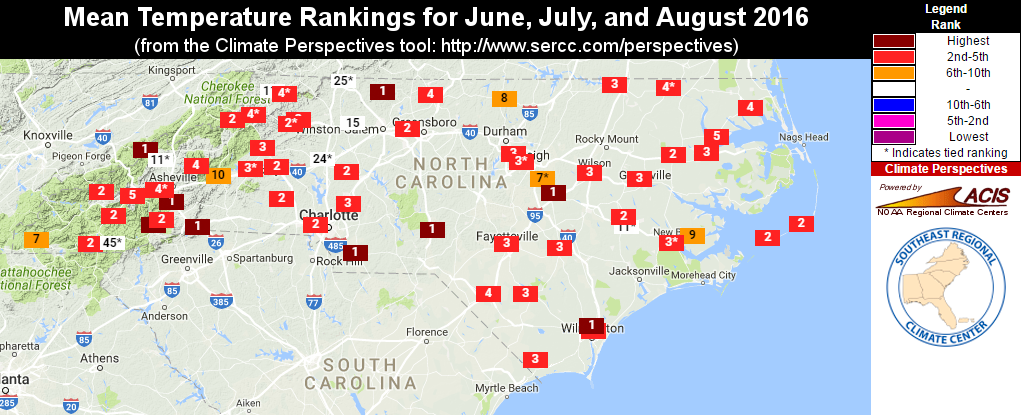
Yes, this summer was a hot one, and the numbers support that statement. The statewide average temperature of 77.69°F ranks as the 4th-warmest summer on record since 1895. It wasn’t just North Carolina that felt the heat, either. Most of the continental US, including the entire east coast, had above-normal average temperatures this summer.
Several sites in North Carolina recorded their hottest summer on record. In Asheville, it was the hottest summer out of the past 122 years, edging out the warm recent summers of 2010 and 2011 to take the top spot. Nearby Tryon also recorded its hottest summer since 1917, and Monroe had its warmest summer since 1896, with its mean temperature of 81.7°F a full degree warmer than the previous warmest summer in 2010.
While recent warm summers like 2010, 2011, and 2015 were all characterized by heat waves with temperatures exceeding 100 degrees, this year was a bit different. Only a handful of sites across the state ever saw the mercury reach the century mark, but temperatures in the 90s were widespread and persistent throughout June, July, and August.
From the beginning of the year through August 31, many sites across the Piedmont and Coastal Plain saw upwards of 60 days with temperatures at or above 90 degrees. That includes 56 days in Wilmington, which is the 4th-most on record; 58 days in Raleigh, which ranks as the 10th-most all-time; and 68 days at or above 90°F in Charlotte, which is the 5th-most on record.
To frame our sweltering summer in another way, we can look at the heat index, which factors in both the heat and the humidity. So far this year, Fayetteville has had an incredible 245 hours — the equivalent of more than 10 full days — with heat index values of 100°F or higher. That’s the most at that site since modern reports began in 1998.
In Raleigh, the 152 hours with heat index values of 100°F or higher ranks as the third-most of any year since 1972, and more than double the long-term average of 72 hours. Charlotte has had heat index values at or above 100°F for 78 hours, which is also double the long-term average and nearly double the amount from the drought-plagued summers of 2002, 2007, and 2015.
Summertime Rainfall Varied over Space and Time
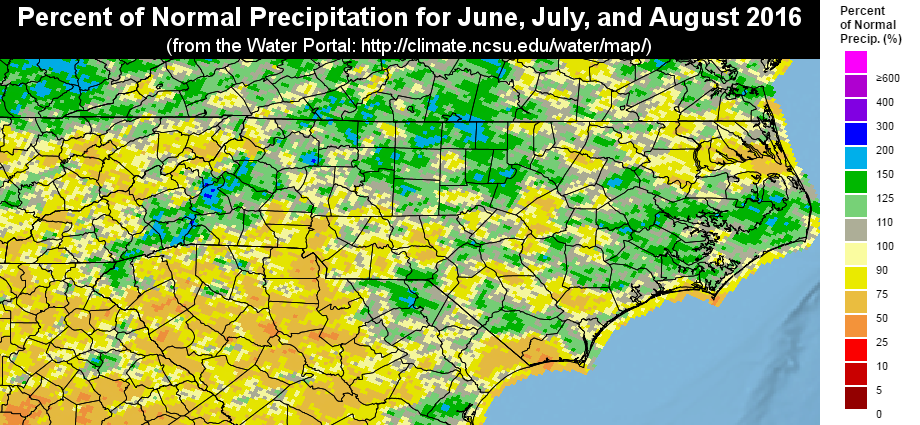
While warm weather was clearly long-lived and widespread across the state, the summer precipitation patterns weren’t as clear-cut. The statewide average precipitation of 14.69 inches ranks as the 51st-driest (or 72nd-wettest) summer out of the past 122 years. However, the summer included both wet and dry periods, and there were some significant differences between how much rainfall different parts of the state received.
June was marked by wet weather in the eastern half of the state while dry conditions prevailed in the Mountains. In July, aside from some locally heavy rainfall from thunderstorm activity, most of the state was a bit drier than normal. And after a wet first two weeks of August, the rest of the month was quite dry.
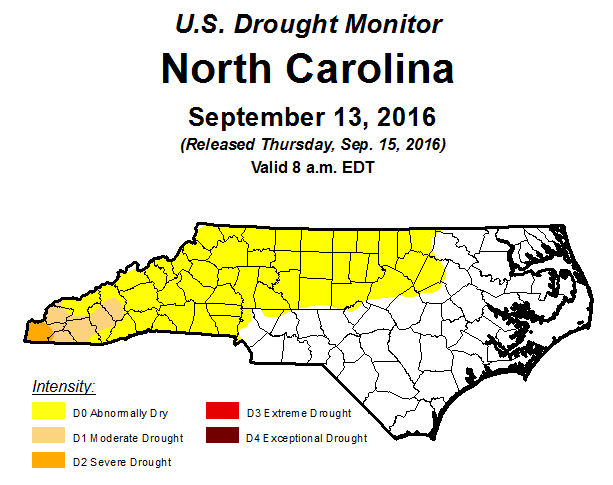
The dry early-summer conditions in the Mountains saw Moderate and Severe Drought conditions emerge and remain in place through the rest of the season. Elsewhere, Abnormally Dry conditions occasionally cropped up across the rest of the state, but timely precipitation — including Tropical Storm Hermine’s soaking rains from two weeks ago — helped keep drought conditions at bay.
For the year to date, most of western North Carolina has seen precipitation deficits of at least 3 inches. Charlotte is 7.1 inches below normal so far this year, and Murphy, which remains in Severe Drought conditions, is facing a deficit of 13 inches, having received just two-thirds of its normal annual precipitation to this point in the year.
Heading into the fall, a sliver of drought conditions remains in a six-county area across the far western Mountains while Abnormally Dry conditions have emerged across the northern and western Piedmont. As we often say, these dry conditions could intensify into drought or disappear altogether depending on what happens over the next month or so.
Looking Ahead to the Fall
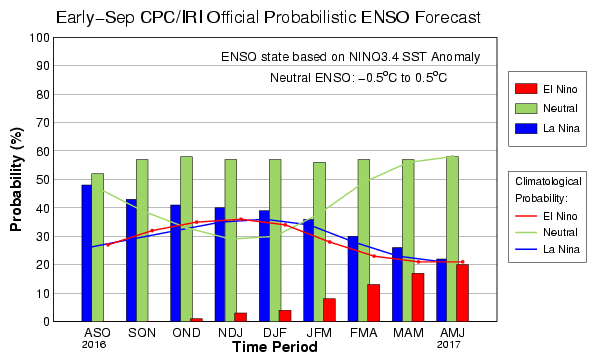
By the fall, we often have a good idea about how the ENSO pattern is shaping up and how it might affect our weather. Last year, for instance, it was clear that a strong El Niño was building and that wet conditions were likely through the late fall and winter.
That El Niño pattern faded away this past spring and left slightly cooler-than-normal sea surface temperatures across the equatorial Pacific Ocean. Although a La Niña event once appeared likely for this fall and winter, current forecast guidance gives only about a 40% chance of a La Niña pattern for the coming winter, with a cool neutral event more likely.
As NOAA’s latest ENSO Blog post explains, several factors are likely to prevent the current cool neutral pattern from developing into a full-blown La Niña. Namely, we haven’t seen a reinforcing shot of cold water beneath the Pacific Ocean surface or atmospheric impacts such as stronger trade winds across the Pacific basin.
La Niña events often mean drier cool-season conditions for North Carolina, and even without such a pattern in place, we may see La Niña-like precipitation impacts as we head into the fall. NOAA’s Climate Prediction Center suggests elevated odds of below-normal precipitation across the Southeast for the three-month period from October through December.
For the rest of September and October, the CPC expects above-normal temperatures to remain in place across the eastern US, with that guidance based largely on climate model forecasts. That same ensemble of models shows warm weather continuing through November across the country.
The stress from the ongoing warm, dry weather could affect the leaf color across the state. In fact, reports from the Mountains suggest that some leaves are already beginning to change. If conditions remain dry as we head into the typical peak of fall color — which begins in early October at higher elevations and late October in the Piedmont — the colors may also not be quite as vibrant, and some trees may drop their leaves early.
Of course, things could still change between now and then, so keep an eye on the trees in your area and an eye on the blog as we track conditions this fall.