This post is part of a series highlighting the summer projects from our office’s undergraduate research assistants. This part of the series is by Karl Schneider, who is a junior majoring in Applied Mathematics and Statistics at NC State University.
Drought gives everyone a rough time. Not only might it ruin your beautiful garden or pool day, but drought also causes serious economic damage. The 2007 drought, for example, caused almost $600 million dollars of loss in the NC agriculture sector alone. The appearance of drought is difficult to predict, so drought monitoring groups such as the NC Drought Management Advisory Council work hard to catch it as it appears, and monitor it as it progresses.
While droughts may be local or affect large geographic regions and many people, the timing and intensity of drought impacts can vary drastically as well. A short period with reduced rainfall and high temperatures, for example, may lead to agricultural drought, significantly reducing soil moisture and damaging crop quality. On the other hand, a long period of reduced precipitation would be needed to significantly reduce reservoir and groundwater levels, known as hydrological drought. These nuances can make monitoring drought challenging.
Our office has developed several high-resolution, gridded drought indices (such as those available in the Water Portal) to assist with drought monitoring across the country. I am evaluating several — the Standardized Precipitation Index (SPI), Standardized Precipitation Index Blend (SPI Blend), and Standardized Precipitation Evapotranspiration Index (SPEI) — against on-the-ground observations including soil moisture, streamflow, and groundwater, which provide useful reference points for drought impacts.
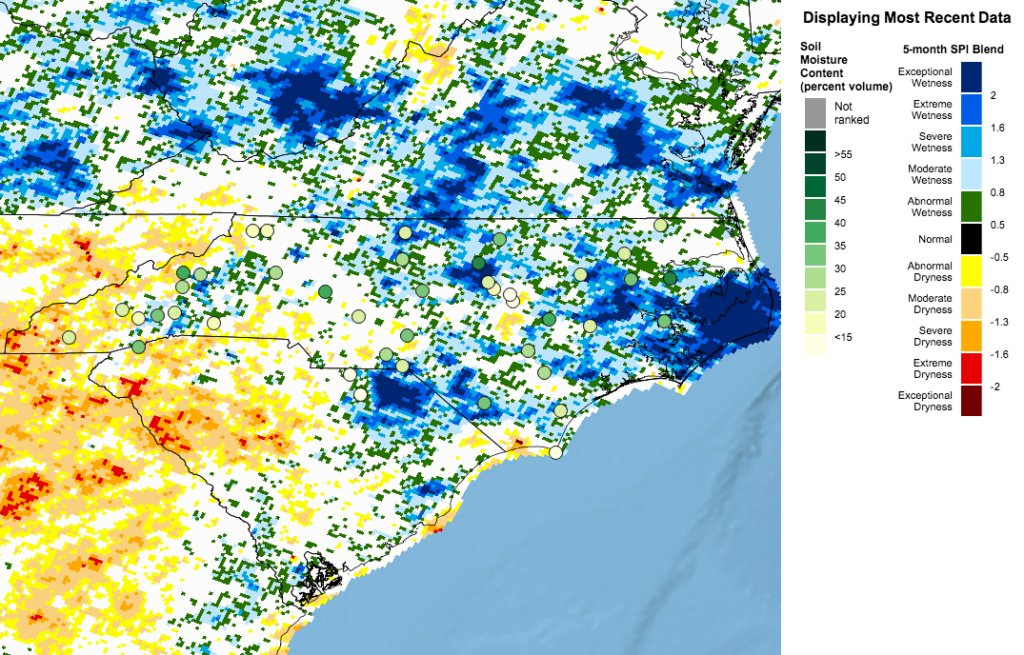
These on-the-ground measurements are only taken at a limited number of sites, like where weather stations or groundwater wells are located, so if we could relate them to the gridded drought indices that cover the entire state, our ability to monitor drought status at any location would be greatly enhanced. Thus, the goal of this project was to find out which relationships between on-the-ground measurements and indices are the strongest and so most useful.
My analysis suggests that SPI Blend and SPEI generally have stronger relationships with the on-the-ground observations than SPI alone. This matches our expectations since SPI Blend and SPEI are meant to be enhancements of SPI. For example, SPEI generally has the strongest relationship with soil moisture, which we expect since evaporation is known to have an impact on soil moisture levels. SPI Blend, which emphasizes recent precipitation, generally has slightly stronger relationships than SPEI with groundwater and streamflow observations.
These relationships strengthen or weaken from site to site and region to region. For instance, the weakest relationships between SPI Blend and streamflow occur at sites on the interior of the Appalachian Mountains, while the strongest are at sites on the Eastern edge of the mountains. Still, none of the drought indices explain all of the variability in on-the-ground measurements in any part of the state. Other factors that influence the strength of the relationships include groundwater well depth and the extent of radar coverage, since radar-based precipitation data is a primary input for the gridded drought indices.
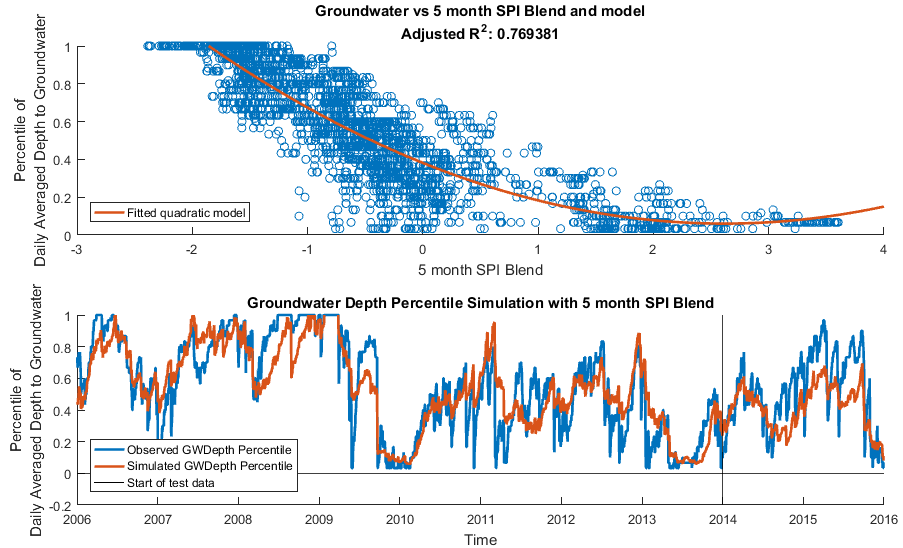
As another way to test the strength of these relationships, I fit statistical models to the data. In the example above, this model compares groundwater depth observations with 5-month SPI Blend data for the same location in the Nantahala National Forest over a ten-year period. The model shows that the two datasets are generally well-correlated — for example, when the depth to groundwater is greater, the drought index is usually lower — but the drought index does not capture abrupt changes in groundwater levels.
The analysis I’ve completed this summer indicates that the gridded drought indices produced by our office can explain some of the changes in on-the-ground drought measurements, making them useful for drought monitoring. Moving forward, there is still more necessary work to determine what factors are affecting the relationships’ nature and strength. As we expand the geographic range of statistical analysis beyond North Carolina and spend more time and effort studying the drought indices, their usefulness will increase for drought monitoring across the country.