This post is part of a series highlighting the summer projects from our office’s undergraduate research assistants. The author, Kieran Riban, is a junior majoring in Statistics and minoring in Economics at NC State University.
It sounds like a sci-fi film: Insects invading the country and destroying our crops! However, invasive pests are a very real problem affecting agriculture and natural resources in the United States. Fortunately, we have a weapon in the fight against them in the form of climate model forecasts, which can provide monthly and seasonal forecasts of many variables including temperatures and precipitation, both of which can affect the likelihood of harmful pests migrating to new areas around the globe.
Results from my summer research will inform the models used in the Spatial Analytical Framework for Advanced Risk Information Systems (SAFARIS) project — a project that is a collaboration between NC State’s Center for Integrated Pest Management and the USDA Animal and Plant Health Inspection Service. SAFARIS utilizes temperature and precipitation data from the Climate Forecast System, a global model that underwent changes in 2011. Climate Forecast System Reanalysis (CFSR) was in place from 1979-2011, but it was superseded by the Climate Forecast System Version 2 (CFSv2) in 2011. My summer research investigated CFSR and CFSv2 to determine if there was a seamless transition with regards to their precision. How do we statistically determine the differences between these climate models and examine their accuracy?
CFSR and CFSv2 were evaluated against ground station observations of temperature and precipitation from the Global Historical Climatology Network (GHCN) monthly dataset. Once extracted, the time series data from each GHCN station was paired with the nearest gridpoint on the CFSR and CFSv2 grids. After the model data was retrieved for the location of each weather station, the distributions of the datasets could be examined.
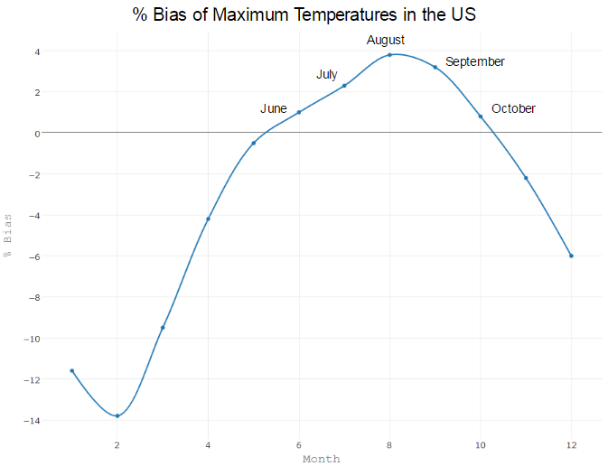
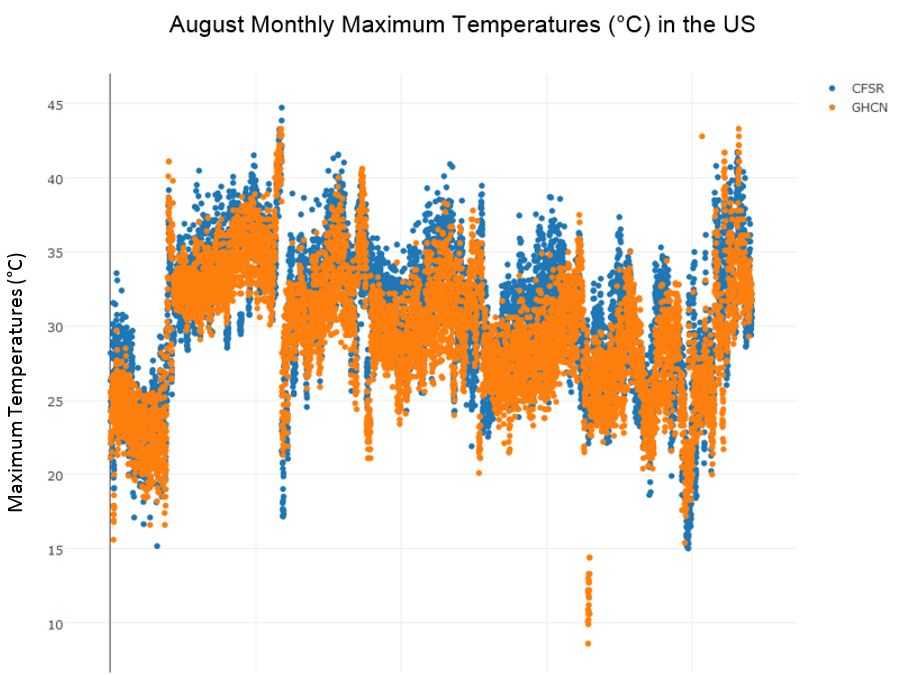
The results suggest high correlations and minimal error among the models and observations for maximum temperature. There are, however, seasonal trends among this bias. The statistic of interest, percent bias, represents the average tendency of the model to systematically overpredict or underpredict the observed values. I broke the data down into regional evaluations because, with global monthly data, it is difficult to draw seasonal conclusions because the Northern Hemisphere’s warmer months are the Southern Hemisphere’s colder months (and visa versa). CFSR maximum temperatures in the United States tend to underpredict the colder months and overpredict the warmer months. The figure below demonstrates the model’s warm bias in the Northern Hemisphere’s summer, with the blue representing CFSR’s model predictions and the orange representing GHCN’s actual observations.
Using GHCN as the observed values, the CFSR model performs better in the US than globally. I suspect this may be because of the highly sophisticated nature of weather stations in the United States, since the testing relies on the accuracy of the GHCN data. For maximum temperature data, the average error (root mean square error) of the model predictions globally is 2.88°C as opposed to 2.01°C in the US, and minimum temperatures have a global error of 2.68°C as opposed to 2.12°C in the US. Monthly total precipitation is also a parameter of interest for this project, but the data has not yet been fully processed. Preliminary results suggest that both CFSR and CFSv2 have more error associated with precipitation than temperature, which is to be expected since precipitation generally varies a lot in time and location.
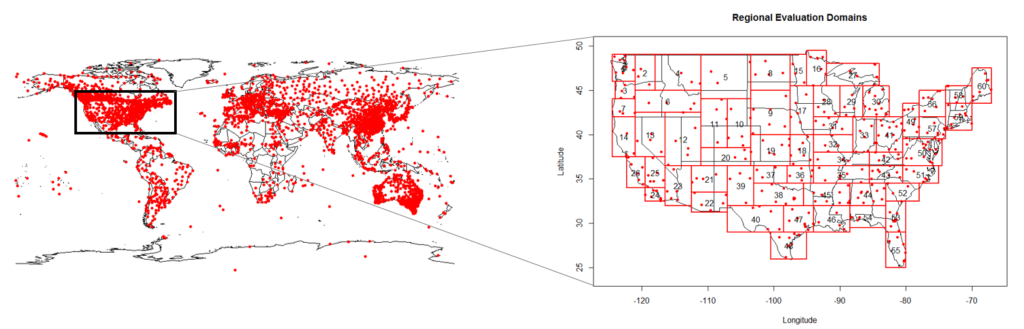
The SAFARIS project focuses on the US at a higher resolution than the rest of the globe, so to further explore these relationships in the continental US I created subregions based on experimental climate divisions from NOAA (National Oceanic and Atmospheric Administration) and ecoregions from the EPA (Environmental Protection Agency). These US subdivisions, pictured below, allow me to statistically analyze both of the models at smaller spatial extents, rather than drawing conclusions about the nation as a whole. One of the most useful analytical tools in this setting is probability density functions, which allow me to see the frequencies of values among multiple datasets at once. At the current stage of my analysis, these frequencies correspond well between the observed and predicted values.
This fall, I plan to continue evaluating these global climate model datasets to further my analysis. Once I obtain the CFSv2 data, I will be able to evaluate more parameters from both models at all of the stations of interest, both globally and regionally. These results will help inform SAFARIS — an important line of defense against invasive species — about how well the climate models match up with observations across the world, especially in the environments that are most vulnerable to pests.