Earlier this week, we talked about how drought is monitored and why spring is a good time to take a step back and evaluate how we’re doing, moisture-wise. Today’s post will be dedicated to a useful drought monitoring tool the State Climate Office of North Carolina has developed.
The Need for High-Resolution Drought Monitoring
Drought information is being increasingly relied upon at county and sub-county spatial scales, yet many ground-based monitoring networks are too coarse to meet this need. Scientists at the NC SCO, in partnership with scientists in Texas and Indiana, have produced operational drought indices at a fine spatial scale (~4km) to address this challenge.
These can be found in the Experimental High Resolution Drought Trigger Tool (HiRDTT), which allows users to view updated-daily maps of several drought indices for various timescales across the contiguous United States. The primary drought index on this website is the Standardized Precipitation Index (SPI), but users can also view maps of accumulated precipitation, percent of normal precipitation, as well as overlay the most recent US Drought Monitor map.
While the HiRDTT was designed for an audience of climatologists, meteorologists, water managers, and others familiar with drought and drought monitoring, we’re always excited to share it with more users who may find it valuable. To see this tool in action, go to: climate.ncsu.edu/drought. (Note: support for the HiRDTT tool has ended and it is no longer accessible online.)
About the SPI
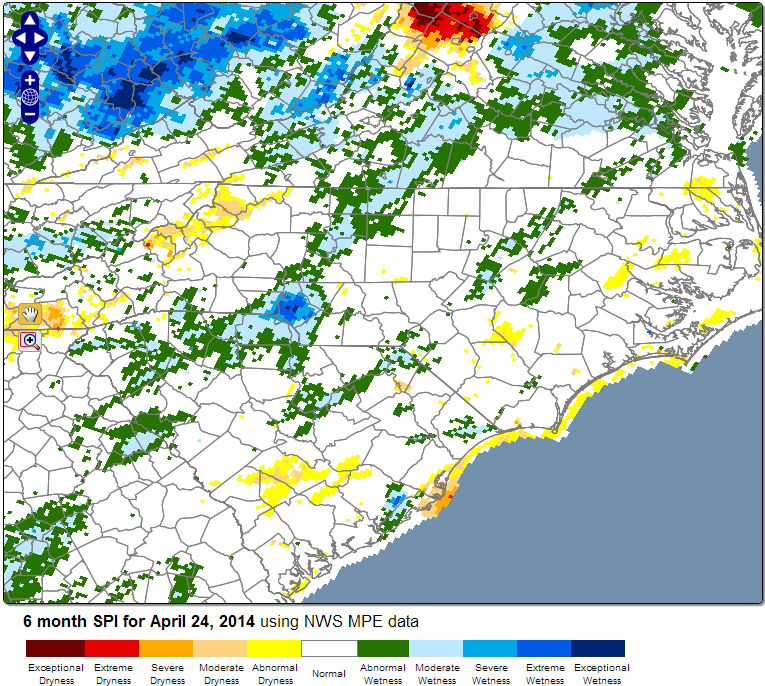
The Standardized Precipitation Index (SPI), developed by McKee et al. (1993), is a precipitation-based, multi-scalar drought index that represents the amount of precipitation for a given period in terms of its historical distribution. Positive SPI values represent greater than median precipitation, negative SPI values represent less than median precipitation, and values between 0.5 and -0.5 indicate neutral, or near normal, moisture conditions. The SPI has several advantages over other drought indices, including the ability to allow both short and long-term conditions to be represented simultaneously, plus allowing for comparison of SPI across time and across locations with differing climates.
The SPI has also been connected to drought impacts. A 1-month SPI is very similar to a 1-month percent of normal, and can reveal moisture conditions in the soil. SPI at a 3-month duration indicates how much precipitation fell over a season in terms of how much would normally be expected to fall, and can reflect agricultural impacts. Longer-term SPI (9-months or longer) indicates moisture conditions in systems that take longer for effects to show, such as lakes, reservoirs, and groundwater supply.
The SPI maps presented here were calculated following logic developed by McRoberts and Nielsen-Gammon (2011), that combines Multi-Sensor Precipitation Estimates (MPE) with historical precipitation information from COOP stations and PRISM normal precipitation maps. MPE data has the advantage of being able to demonstrate how much precipitation fell in areas where there are no recording gauges. Subsequently, using MPE data allows the maps available through HiRDTT to estimate the current status of drought where there are no surface gauges and, perhaps, no one on the ground to measure impacts.
Future Plans
In the next week, we plan to add monthly Palmer Drought indices to the tool. We’ve also just begun the process of calculating the Standardized Precipitation Evapotranspiration Drought Index, which is computationally similar to SPI but takes into account the effects of evapotranspiration.
The HiRDTT is still very much an experimental tool and is currently being evaluated by US Drought Monitor authors and SCO scientists as well as scientists within various institutions across the nation. We hope that the results of these evaluations will reveal that the HiRDTT is a valuable addition to the suite of tools drought managers use. In the meantime, we’re happy to receive any feedback.
We would like to acknowledge the National Weather Service and the PRISM Climate Group for openly providing the datasets used in the calculations of the drought indices found within this tool. Additionally, we would like to acknowledge all of the scientists who have evaluated, or are currently evaluating, this tool.