This post is part of a series highlighting the summer projects from our office’s student research assistants. The author, Lexia Williams, is a current junior majoring in Meteorology and minoring in Mathematics at NC State University.
Precipitation tends to be quite frustrating. When it rains or snows, our outdoor plans can be ruined, but when it doesn’t, our crops can dry up. Because of this, knowing more about the timing and amount of precipitation events can help us plan ahead for when we have rainy days, or periods that are more dry.
Although we cannot always predict exactly when and where precipitation will occur, global patterns such as El Niño and La Niña are known to have seasonal patterns across the world that do affect North Carolina. The goal of my summer project was to study historical precipitation amounts during previous El Niño and La Niña events to determine which parts of the states were wetter or drier than normal along with the timing of each of these precipitation events through the year.
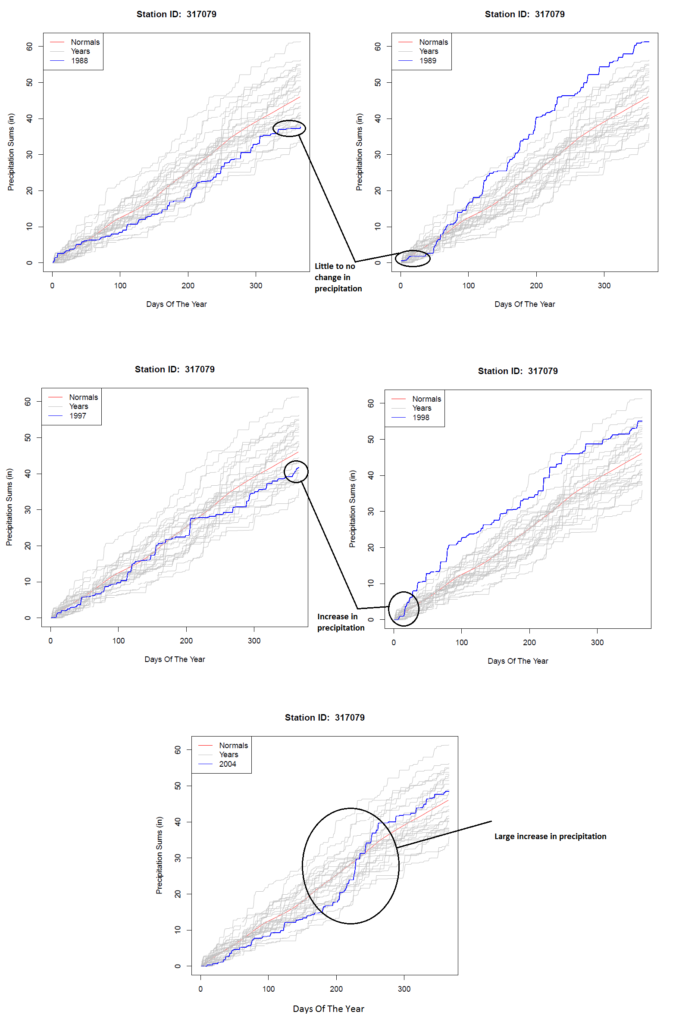
Using weather observations from the National Weather Service’s Cooperative Observer (COOP) weather stations, this study averages daily precipitation over the eight different climate divisions that split up North Carolina. I used data during one strong El Niño event, 1997-1998, one strong La Niña event, 1988-1989, and one active hurricane season for North Carolina, 2004. I compared these five years to the 1981 to 2010 climate normals to show which time periods showed above-normal and below-normal precipitation.
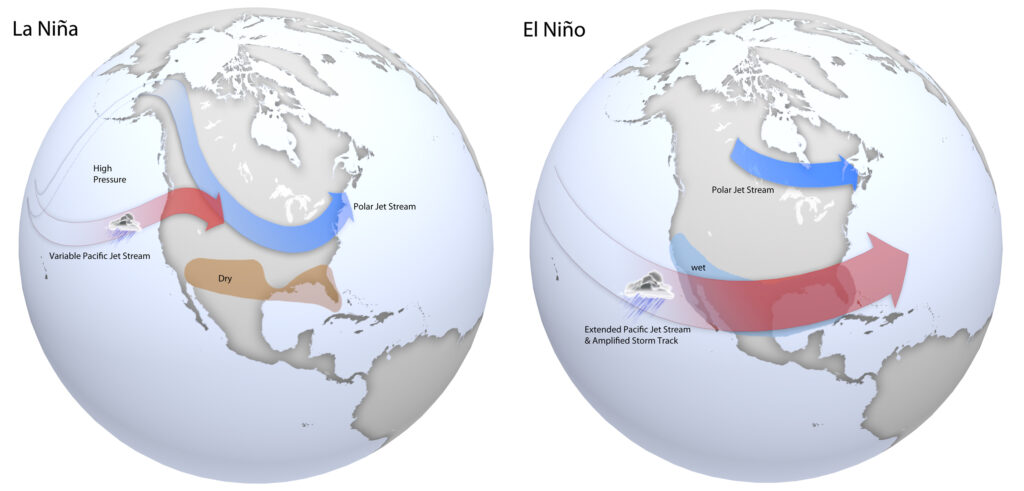
La Niña conditions occur when the sea surface temperature across the equatorial Pacific is cooler than average during any given year. These conditions force the polar jet stream and cold air over the western part of the United States bringing drier and warmer weather to North Carolina. This is the case during the 1988-1989 La Niña. December of 1988 and January of 1989 were particularly dry and as a whole, North Carolina received 20% less precipitation than normal in 1988. By the late winter and early spring, the La Niña diminished and precipitation became much more frequent with 1989 receiving 19% more precipitation.
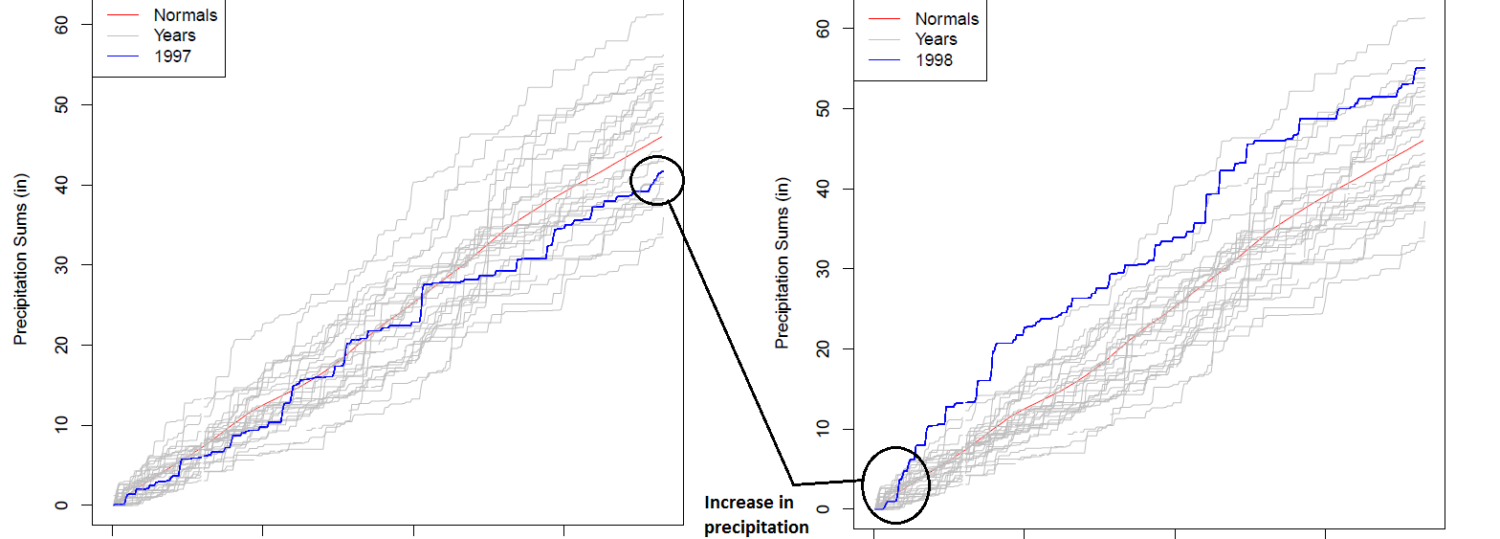
During an El Niño event, sea surface temperatures across the equatorial Pacific are warmer than average. During this event, these conditions are often associated with a stronger, more amplified Pacific jet stream over the southern US, bringing enhanced precipitation and sometimes cooler temperatures if the polar jet stream also sags southward. Drier weather was observed through the late summer of 1997 until January through March of 1998 where enhanced precipitation occurred. Through 1997, North Carolina ended the year with 7% less precipitation while 1998 ended with 10% more than normal.
While El Niño and La Niña events generally saw similar wet and dry conditions, this may not always be the case. I was also interested in the amount of precipitation that occurred during an active hurricane season. In 2004, North Carolina was affected by seven active systems that brought out some large differences among the different divisions, and probably not in the way that you’d expect.
The Mountains were the most wet part of the state this year when three storm remnants moved through the region. Frances, Ivan, and Jeanne all emerged from the Gulf of Mexico causing the mountains to have 65.07 inches of precipitation, which was 14% more than normal. North Carolina’s three Coastal Plain climate divisions also received tropical precipitation from Alex, Bonnie, Charley, and Gaston which all grazed the coast. However, the Piedmont did not see much total precipitation in 2004, and because of an otherwise dry summer, it was a dry year for the central part of the state. The Central and Northern Piedmont region finished off the year with 1.41 and 2.61 inches of precipitation less than normal.
All of these historical events can prove to be a useful reference for the remainder of the year. As we head into La Niña towards the beginning of the year, the current hurricane season is expected to have near-normal to above-normal activity. Depending on the location of these storms, we could observe above-normal precipitation towards the latter end of the summer and beginning of fall. North Carolina is also expected to observe drier-than-normal winter conditions across the state as well.
This fall, I plan on continuing this research, including creating plots for water years (October 1 to September 30) so that the affects of El Niño and La Niña are easier to read. I also plan to look at more years to see if they have similar or differing impacts on precipitation amounts and timing during these events. Finally, I plan to build a web tool that will display these comparison plots for user-selected time periods.