This post is part of a series highlighting the summer projects from our office’s undergraduate research assistants. The author, Jessica Miller, is a senior majoring in Applied Mathematics at NC State University.
Have you ever driven by a crispy-looking cornfield or lugged extra water out to your wilting garden and wondered how scientists measure drought? During hot summers with little rain, when does a dry spell turn into a severe weather phenomenon that worries farmers, hydroelectric industries, and local residents alike?
Recently, I have worked on calculating the Standardized Precipitation Evapotranspiration Index (SPEI), a drought index that provides a measurement of the length and severity of droughts for many time periods and locations. A variety of drought indices are used by scientists for monitoring drought but many of these can be limited by a fixed time scale (Palmer Indices) or by being based only on one variable (SPI). SPEI overcomes these limitations by including sensitivities to both precipitation and temperature values, applicability in all types of climates, and the ability to be calculated on a moving temporal scale.
For this project, we use National Weather Service cooperative observer (COOP) weather stations for the contiguous United States and their daily precipitation and temperature records from 1895 through 2013. The basis for all calculations is the current water balance: the difference between outgoing and incoming moisture. Incoming moisture is quantified using precipitation and outgoing moisture is measured with potential evapotranspiration – a combination of temperature, location, and calendar day.
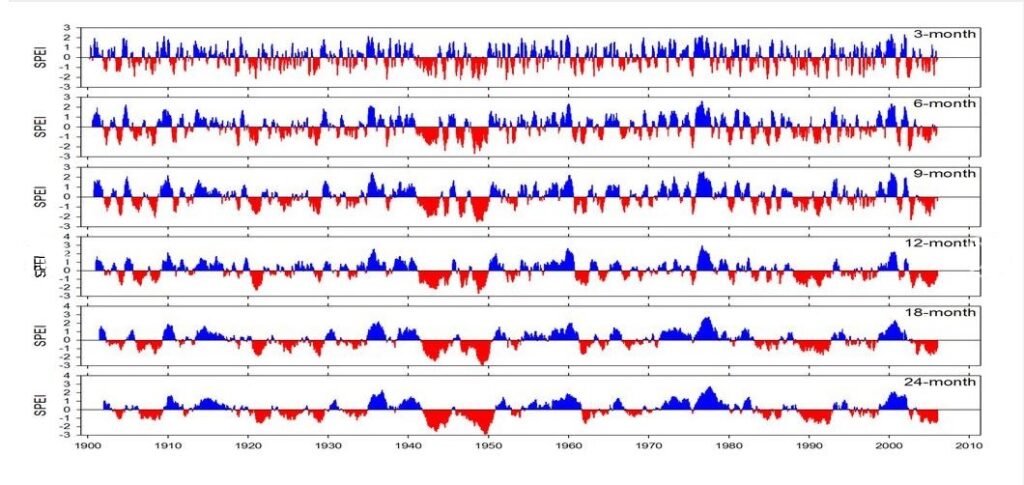
We accumulate these balances on 14 time periods (1-9, 12, 15, 18, 24, and 36 months), concluding with a distribution fitting the historical data. The image above is an example of how various time scales affect the quantification of drought; the 3-month accumulation range shows more precise periods of dryness and wetness compared to longer ranges.
Our calculation of SPEI is unique because we use gridded data (PRISM) and multi-sensor precipitation estimates (MPE) with daily updates for the greatest accuracy. These values are used to calculate the water balance (P – PET) for a given period and ending date of interest, then combined with the historical distribution parameters to determine the probability of the observed P – PET. This is transformed using an inverse normal function so the SPEI is a normally distributed variable with a mean of zero and a standard deviation of one.
We will take the project a step further by clustering the stations. This allows us to calculate historical distribution parameters that vary more smoothly both spatially and temporally than at-site analysis alone. Thus, the SPEI will apply to the contiguous United States with as much localized detail as possible.
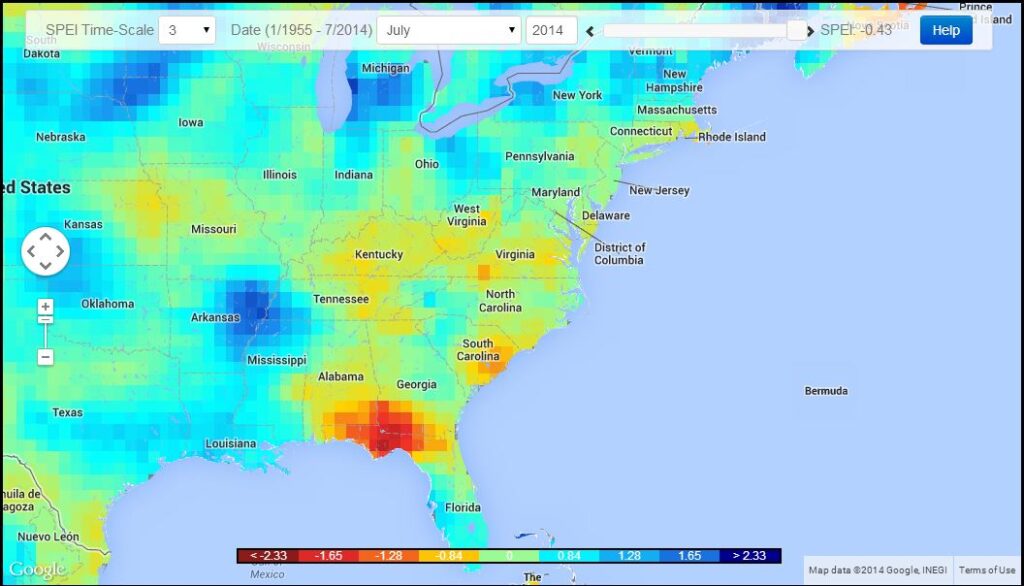
Overall, the project will allow anyone who wishes to see the levels of drought or wetness in an area to use this index as a reference. For instance, a farmer might want to check the drought levels before planting a crop. Using the SPEI, he or she can choose a location, date, and length of time, view the resulting high-resolution (~4km) SPEI maps, and thus make informed monetary and environmental decisions.
Sources:
- SPEI Home Page used for statistical methodology and images
- SPEI Global Drought Monitor for current and past drought calculations
- Original SPEI Algorithm by Vicente-Serrano et al.
- Revised SPEI Algorithm by Begueria et al.