This post is part of a series highlighting the summer projects from our office’s student research assistants. The author, Jessica Miller, recently entered the PhD program in Statistics at NC State University.
Do you remember when North Carolina first found itself in a state of drought earlier this summer? The climatological phenomenon received more attention from the media, scientific community, and general public than usual. With my background in math, I can provide some insight to drought measurement from the eyes of a statistician.
Drought is difficult to monitor because moisture levels depend on numerous variables, including precipitation, temperature, soil moisture, water demand, and, in the western US, even snowpack. Drought differs greatly over both location and time; therefore, any calculations are truly just estimations. Here at the State Climate Office, drought is a daily topic of research and investigation as we attempt to bring these estimations closer to the true values.
A variety of indices are available to determine drought, each with its own specializations. For instance, the Palmer Drought Severity Index works best in farmland and thus is the primary index for the US Department of Agriculture. The Standardized Precipitation Index calculates drought over many monthly periods using only precipitation data, which shows dryness levels over time.
I am working towards the calculation of the Standardized Precipitation Evapotranspiration Index (SPEI), a unique drought index based on precipitation and temperature observations. It is built around a formula for climatic water balance, the difference between precipitation and potential evapotranspiration (P-PET). SPEI combines several aspects of previous indices, such as the incorporation of monthly time series and the standardization of values across all locations. Read all about the details of the index in my blog post from last year.
Believe it or not, statistics are widely used in climatological computations. One of the primary steps in our calculation of SPEI is cluster analysis, a statistical technique that connects points, objects, or even weather stations with similar qualities. It is especially helpful when interpolating data between weather stations because we can make assumptions based on the surrounding cluster when we have little to no observations.
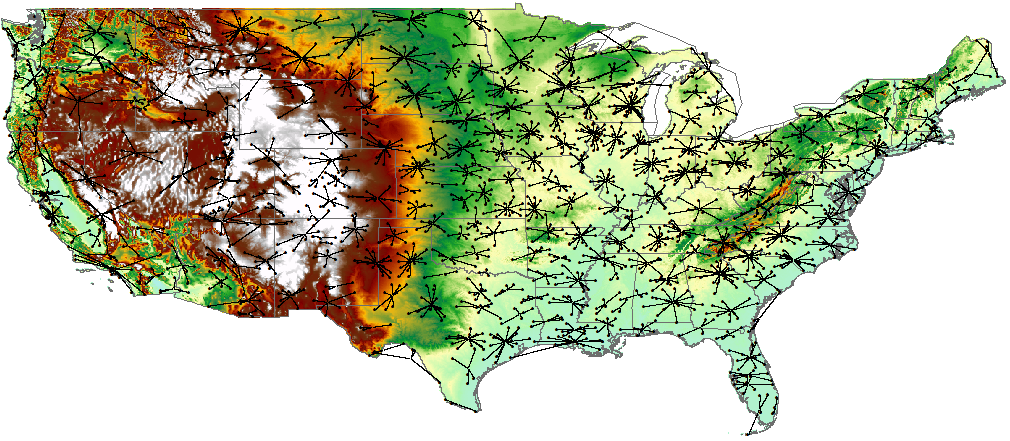
For example, if farmers in Mt. Airy, NC would like to know the drought level of their land but don’t have a station close by, we can estimate the value of SPEI using a weighted combination of data from a cluster of nearby stations sharing the same climate characteristics. The image above shows clusters of COOP stations generated by one of our staff members. Through cluster analysis and interpolation techniques, drought and moisture levels are available throughout the country.
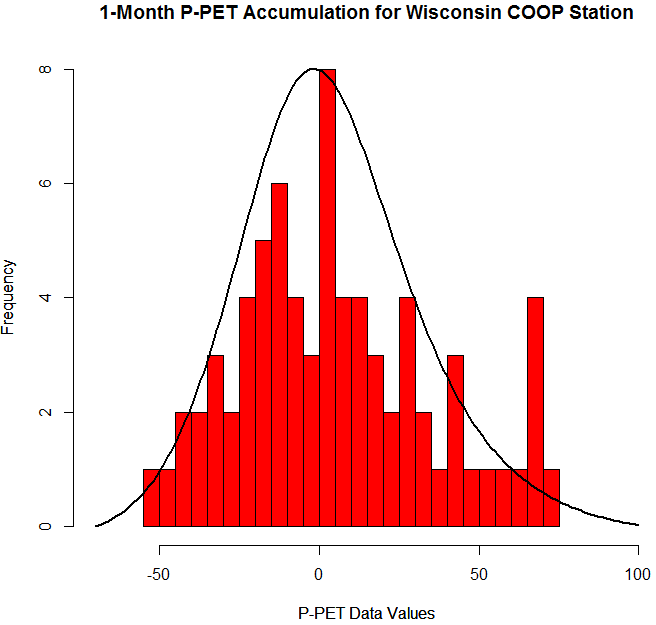
The most important step to calculate SPEI is finding accurate parameters to fit the distribution to the data. Each set of data contains P-PET values accumulated over various lengths of time for every calendar day and every weather station. By finding the location, scale, and shape parameters, we can fit a curve to the data and quantify its characteristics. The more accurate the parameters are, the tighter the curve fits and the better those values describe the P-PET data. The image below is an example of a curve, or probability density function, fit to the raw data. Then, the parameter values can be standardized to allow for comparison with other stations or accumulation periods to show variation in drought levels. Because of statistical methods like cluster analysis and distribution fitting, SPEI can be applied to locations that aren’t at all similar, such as the Colorado Rockies and North Carolina’s Outer Banks.
Although statistics are (in my biased opinion) the most interesting part about drought assessment, it takes much more than a computer program to determine the severity of dry conditions. Numerous experts from around each state meet weekly to discuss moisture levels in the form of recent rainfall and temperatures, reservoir and groundwater levels, fire and agriculture reports, and much more.
Drought indices help quantify dryness over time, but it is the additional inputs from specialists at state forest services, weather service and climate offices, and even local farm reports that give us a full picture of what’s happening on the ground. The results of their combined assessments are incorporated into the weekly US Drought Monitor.