
June was warm overall thanks to a late-month heat wave and mostly wet due to early-month showers and storms. It also saw several air quality hazards, as revealed by our recent AIR tool updates.
Building to a Summer Sizzle
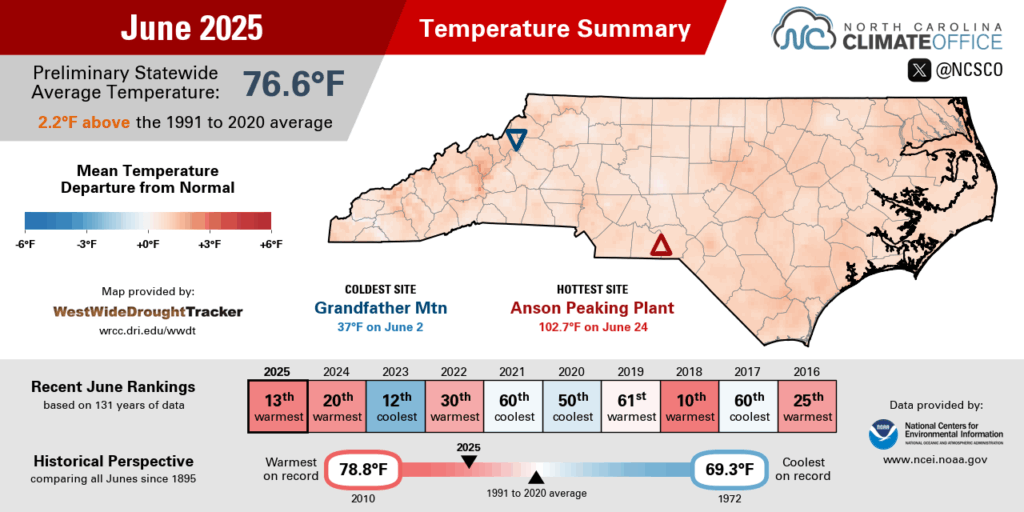
Boosted by a late-month heat wave, last month was our state’s warmest June since 2018. The National Centers for Environmental Information (NCEI) notes a preliminary statewide average temperature of 76.6°F and our 13th-warmest June since 1895.
A number of sites had one of their top five warmest Junes on record, including the record warmest June in Raleigh dating back to 1887. It was the 4th-warmest June in Boone, Greenville, and New Bern, and the 5th-warmest June for Lumberton.
We certainly didn’t start on such a warm note, though. Early in the month, several cloudy days held down our temperatures. On June 5 with rain moving in ahead of a warm front, the high topped out at just 78°F in Raleigh, 75°F in Lillington, and 73°F in Jackson Springs – the coolest June day at all three sites since June 21, 2023.
By the third weekend of the month, the pattern changed with high pressure setting up over the Carolinas. That heat dome pushed our temperatures well into the 90s for more than a week to end the month.
Those 90-degree days added up in impressive amounts. Reidsville hit the 90-degree mark on 13 days – tied for the 3rd-most in any June out of the past 62 years there, and trailing only the 14 days that hot in both June 2008 and June 2010. Raleigh reached the 90s on 21 days last month, which was tied for its 5th-most in June and the most since the record 25 days in June 2011.
A few areas even hit the 100-degree mark. Raleigh had back-to-back 100°F days on June 23 and 24, our Lilesville ECONet station reached 102.7°F on June 24 for its highest temperature since June 30, 2012, and Charlotte hit 100°F on June 25 in its first triple-digit day since July 5 of last year.
We even saw some high heat in areas where it usually isn’t too common. Asheville had six days in a row between June 22 and 27 with high temperatures in the 90s, which was its longest such streak since seven 90-degree days in a row in July 2020. And Hatteras, which is moderated by the cooler ocean, topped out at 95°F on June 24 – the hottest day there since July 10, 1992.
Summer Showers Fuel a Wet Month
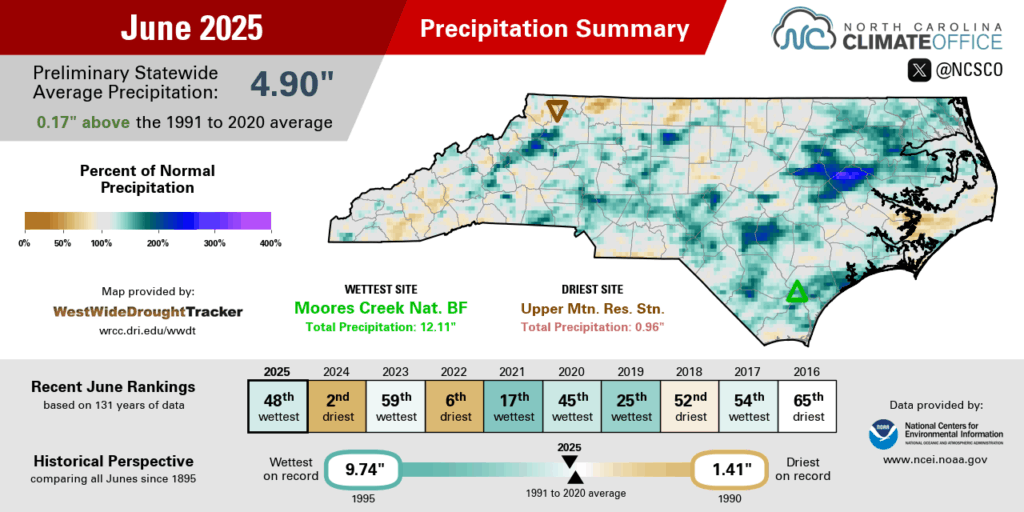
Any lingering traces of dryness from the spring were washed away by June’s regular rainfall across most of the state. According to NCEI, the preliminary statewide average precipitation was 4.90 inches, which ranks as the 48th-wettest June out of the past 131 years.
It was especially soggy in the east, including the 5th-wettest June on record for Greenville, the 7th-wettest in Williamston, and the 8th-wettest for Elizabeth City. Across the Piedmont, most areas were near their average monthly rainfall: Charlotte, Greensboro, Raleigh, and Fayetteville were all within half an inch of normal.
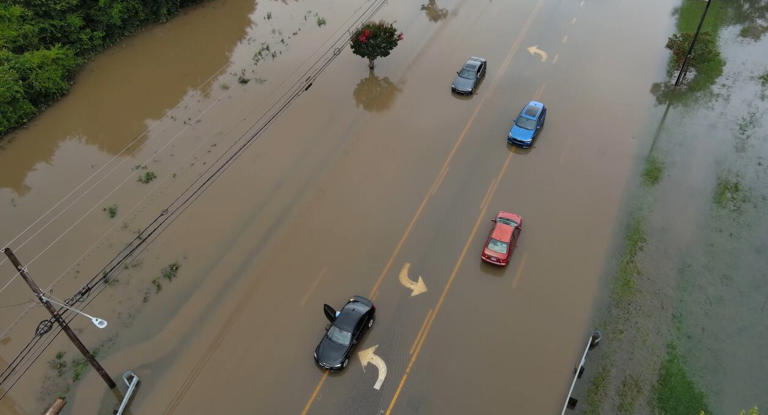
June’s rain was largely front loaded with multiple heavy events in the first three weeks of the month. The cool, wet spell on June 5 and 6 included almost three inches of rain in Concord. A stationary front on June 14 to 16 brought drought-ending totals of 3 to 6 inches in the northern Coastal Plain. And thunderstorms on June 19 produced damaging winds in the northern Piedmont and more than an inch of rain in Raleigh and Rocky Mount.
Even during the late-month heat wave, showers and storms were still fairly frequent, with local totals of more than two inches on June 27, 28, and 29. That was a big difference from a year ago, when our extreme heat was accompanied by a prolonged dry spell in our 2nd-driest June on record.
It wasn’t a wet month everywhere, though. Parts of the Mountains and northern Piedmont missed out on the heavier showers and finished June several inches below their normal rainfall.
Mount Airy was 3.26 inches below normal in its 15th-driest June out of the past 118 years. Hickory was 2.37 inches below normal for its 13th-driest June on record. And Transou in Ashe County had only 1.01 inches of rain all month – 4.36 inches below normal – for its 2nd-driest June since 1946.
Thanks to a surplus of moisture from the May rains in those northwestern areas, we didn’t see drought creep back in by the end of June, but some streamflows along the Virginia border did finish the month below normal, reflecting the recent lack of rainfall.
Air Quality Updates
The past few months have been active in terms of air quality hazards across North Carolina, and the latest updates to our Ambient Information Reporter (AIR) tool – developed through a partnership between our office and the NC Division of Air Quality – help highlight the local impacts of those events.
This spring, our ongoing drought plus several dry, windy days – along with tree debris from Hurricane Helene in western North Carolina – combined to fuel a number of large wildfires across the state. The smoke from fires like these contains fine particulate matter, or PM2.5, which can result in locally unhealthy air quality.
Using visibility observations from airport-based weather stations, NC DAQ’s forecasters were able to see how thick and widespread this smoke was. For example, on March 28, smoke from the Rattlesnake Branch fire in the Pisgah National Forest reduced visibility in Asheville to just 3 statute miles with haze reported.
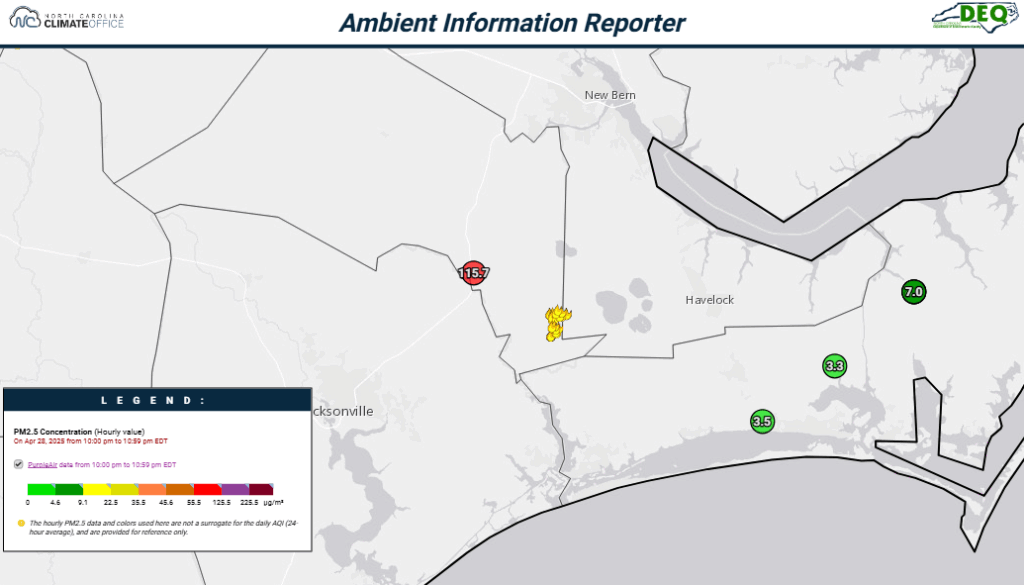
Another new addition to the AIR tool also helps identify elevated PM2.5 concentrations due to wildfire smoke. PurpleAir monitors – low-cost sensors that have become an opportunity for citizen scientists to collect data in their backyards and communities – help fill in gaps between existing regulatory monitors and pinpoint local impacts from events like these.
For instance, when the Black Swamp fire began burning in the Croatan National Forest in late April, a nearby PurpleAir sensor in Maysville was the first monitor to pick up elevated pollutant concentrations – in the Code Red, or Unhealthy, range – which helped inform adjustments to the local air quality forecast.
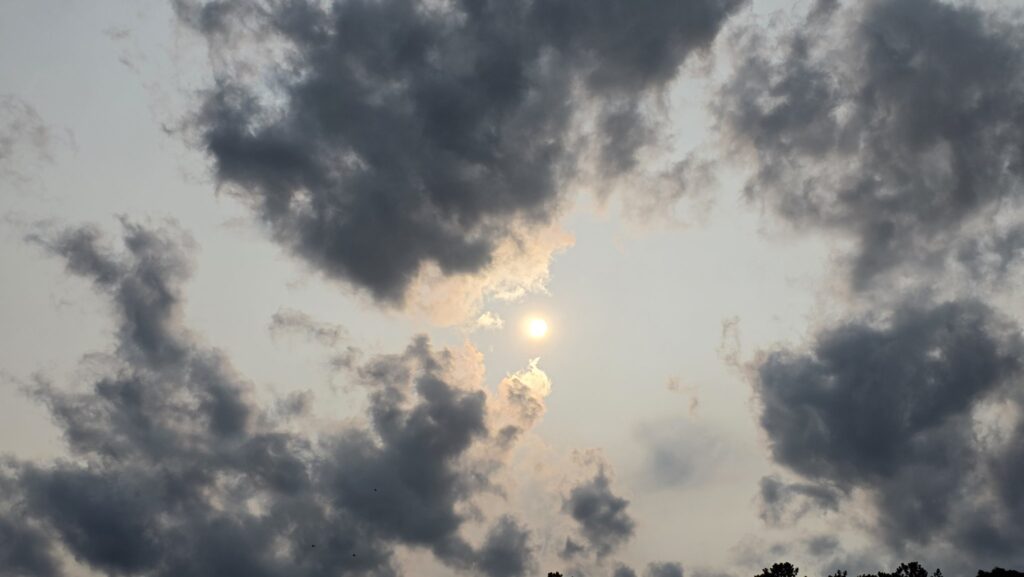
Even after our state’s spring fire season wrapped up, we still saw some hazy days in early June as smoke from Canadian wildfires was carried southward by upper-level winds. While this event fortunately wasn’t as long-lasting or severe as a similar event two years ago, it still had some air quality impacts in North Carolina.
On June 11, a stalled front across the state meant smoky air from the northwest would likely infiltrate some northern and western areas, which prompted a Code Yellow or Moderate Air Quality Index forecast for much of the Mountains and Piedmont. Sure enough, our wealth of regulatory and PurpleAir monitors showed daily average concentrations in the Code Yellow range in these areas on June 12.
Most recently, during our late-June heat wave, the combination of sunny skies, extreme temperatures, light winds, and a stagnant air mass overhead offered ideal conditions for ground-level ozone formation. During that event, another new AIR tool development came in handy.
The Hourly AQI layer shows the highest Air Quality Index value among all pollutants measured by each monitor, giving our best at-a-glance picture of the current air quality. That was evident on June 23 at 3 pm, when hourly AQI levels spiked into the Code Red range in Person County associated with a narrow plume of ozone.
While the daily average AQI finished in the Code Green range, the Hourly AQI data might have convinced folks around Roxboro to hold off on their afternoon outdoor activities during those short-lived unhealthy conditions.
For more about the latest AIR tool datasets and features, see NC DAQ’s recent post on the Air Quality Blog. And you can always check the latest air quality and weather forecasts for your area on our Air Quality Portal dashboard.