Our summer started not with sun but smoke last week, which yielded the most widespread hazardous air quality episode seen in many years across the eastern United States.
Together with our partners at the North Carolina Division of Air Quality (NC DAQ), who are responsible for operating a network of air quality monitoring sites and issuing air quality forecasts for the state, we’re taking a closer look at this event and its impacts on our air here in North Carolina.
The Source of the Smoke
An anomalous ridge of high pressure built over Canada this spring, allowing for record warmth and dry conditions to prevail across the entire country. By late May, a combination of unseasonably warm temperatures reaching into the 90s and dry weather across Quebec provided ideal conditions for wildfires to develop.
When thunderstorms did move through, lightning strikes ignited even more fires. In total, more than 150 wildfires in the province burned almost 400,000 acres through the first week of June.
In North Carolina, we have enjoyed comparatively cooler weather over the past month, but ironically, the overall weather pattern behind those otherwise comfortable conditions eventually pushed the smoke in our direction.
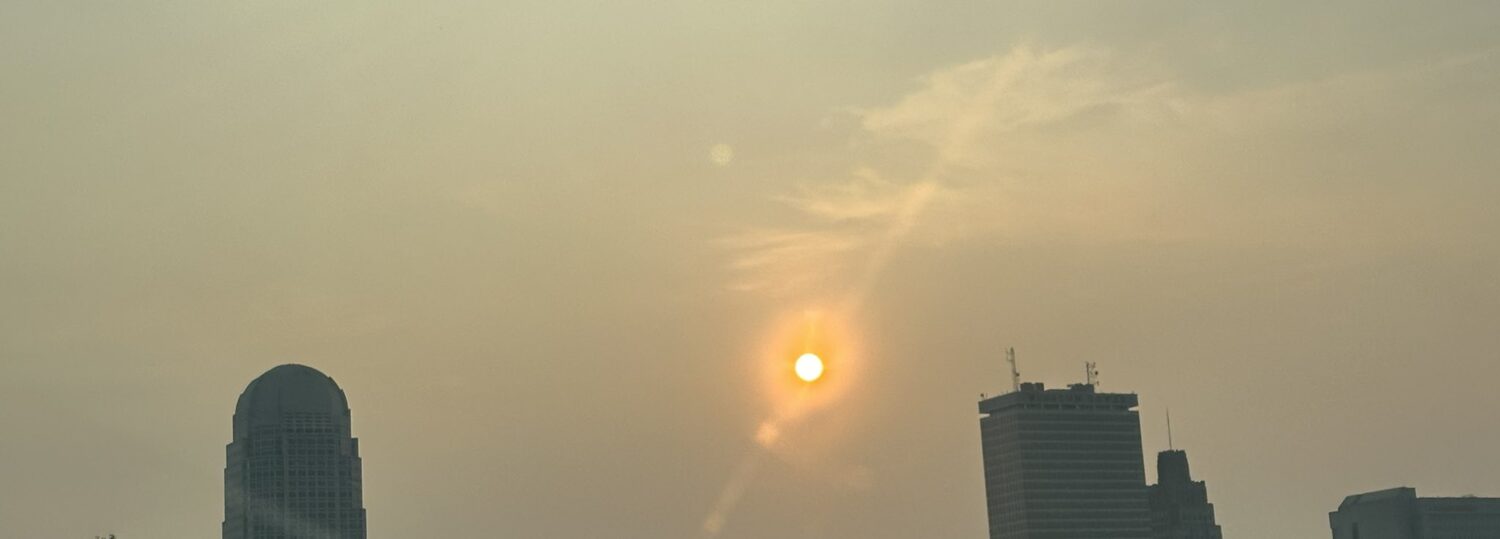
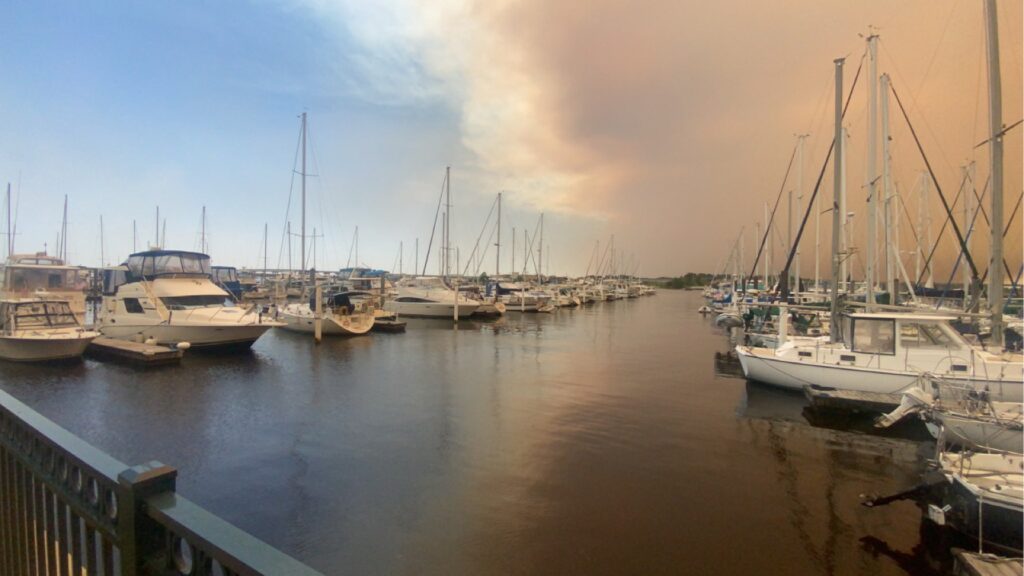
North-northwesterly winds around a near-stationary upper-level low pressure system off the Northeast coast funneled the smoke southward by the middle of last week. On its way to North Carolina, it created Code Purple air quality across the mid-Atlantic region – complete with a spooky orange haze – on Wednesday, June 7.
Our own air quality issues began on Tuesday, June 6 as a cold front pushed in from the north, bringing along the smoke and trapping it near the ground beneath a layer of dense cloud cover, which sent pollutant concentrations rising.
The upper-level low pressure system that was anchored to our north delivered a persistent feed of smoke-laden air direct from Canada into our region. As that upper-level low slowly pulled away to the north and east over the weekend, the smoke transport ended and particle pollution levels gradually lowered.
This same sort of setup was responsible for another recent poor air quality episode in July 2021, when smoke from central Canada moved in, briefly elevating hourly pollutant levels across much of the state.
Observed Conditions
The main concern during last week’s smoke event was fine particulate matter: effectively, tiny bits of burned-up trees and ash carried by the wind from the far-flung fires in eastern Canada, including Quebec and Nova Scotia.
This type of pollution is classified as PM2.5, or particulate matter less than 2.5 micrometers in diameter – just a fraction of the width of a human hair. Because of their small size, these particles can be easily inhaled and cause respiratory problems, along with irritating the eyes, nose, and throat.
The EPA standard for assessing PM2.5 levels is the daily average concentration — that is, the 24-hour average from midnight to midnight — as measured by NC DAQ’s network of official monitoring stations across the state. NC DAQ’s forecasters are predicting this daily average with their air quality forecasts for PM2.5.
Additionally, this concentration serves as the basis for the color-coded Air Quality Index classification, which reflects the health impacts of sustained exposure.
Daily average concentrations of at least 35.5 micrograms per cubic meter are equivalent to the Code Orange category, or Unhealthy for Sensitive Groups such as children, the elderly, and those with heart and lung conditions. And when daily average concentrations exceed 55.5 micrograms per cubic meter, that’s in the Code Red range, or Unhealthy for everyone.
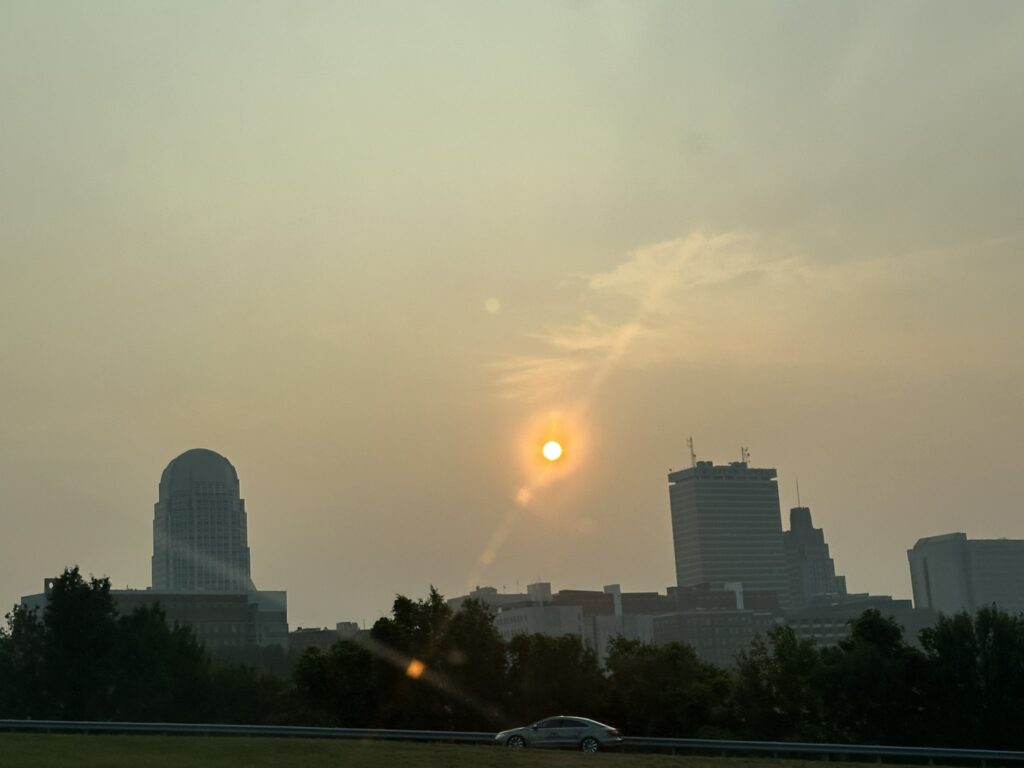
The first signs of worsening air quality during this event showed up on Tuesday across the Triad. That afternoon, observed PM2.5 concentrations at the Hattie Avenue monitor in Winston-Salem spiked to 76.2 micrograms per cubic meter – firmly in the Code Red range, if the concentrations had stayed that high all day long. The daily averages for both of NC DAQ’s Forsyth County monitors wound up at Code Orange levels.
For Wednesday, NC DAQ forecasted widespread Code Red conditions across the Piedmont and northern Mountains. On that day, monitors in Montgomery and Wake counties registered maximum 1-hour concentrations within that range, although fine particulate concentrations lowered later in the day, which left most areas with a Code Yellow daily average.
Raleigh’s Millbrook monitor did record daily average PM2.5 concentrations in the Code Orange range on both Thursday and Friday. This was the first multi-day Code Orange PM2.5 event for the Triangle since November 18-19, 2016, when smoke from the Appalachian wildfires wafted across the state.
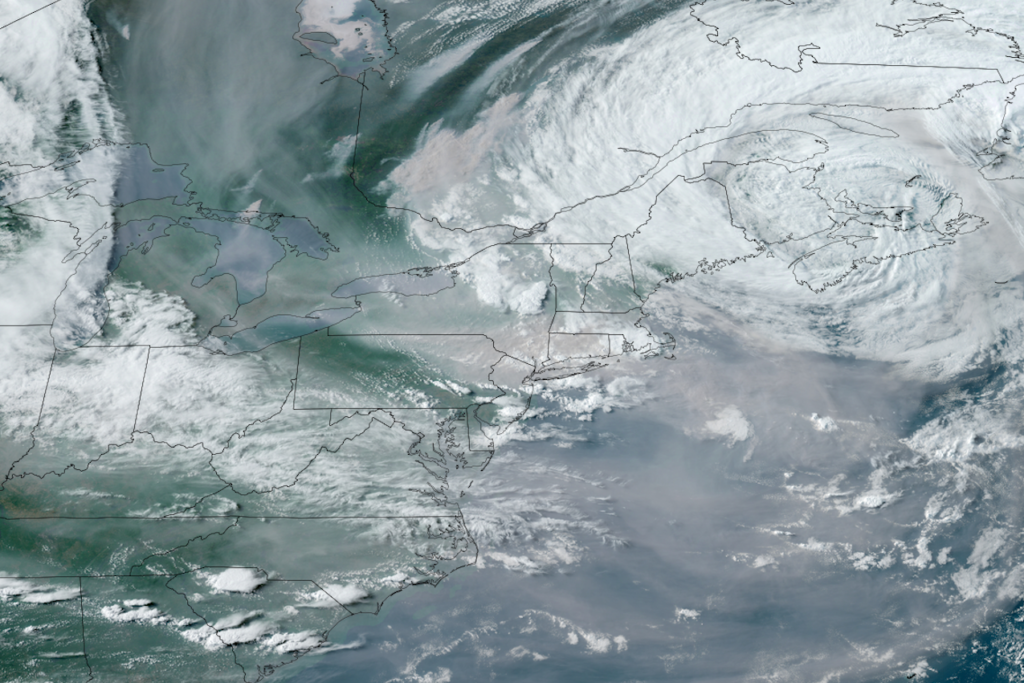
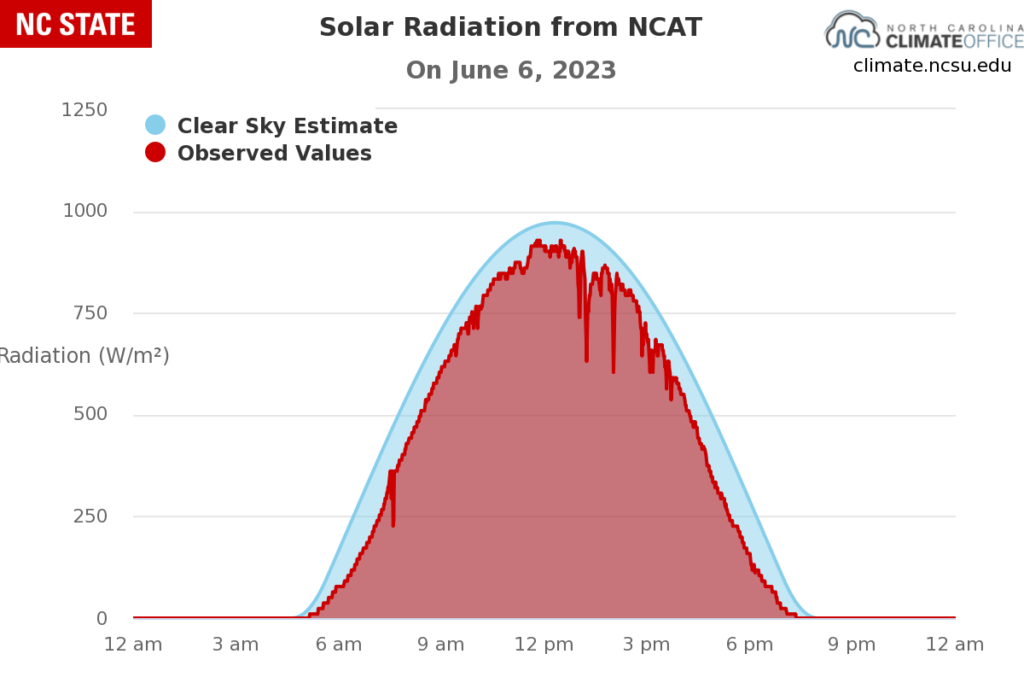
Most of the state experienced Code Yellow AQI levels or worse from Tuesday through Sunday. That was accompanied by elevated ozone concentrations along with hazy skies associated with the lingering smoky air mass, which was visible on satellite imagery and even detectable by our ECONet. On Tuesday evening, our station in Greensboro measured solar radiation values up to 40% lower than expected during an otherwise clear day at this time of year.
A Rare Air Quality Event
North Carolina has seen significant air quality improvements, largely because of regulations on vehicle and power plant emissions that have cleared the air locally. In recent years, it has taken specific atmospheric setups or large wildfires to cause severe and/or prolonged air quality concerns.
However, some parts of the state have already seen reduced air quality this year from sources closer to home. This spring, a fire burning in our relative backyard was also responsible for periods of low visibility, depleted air quality, and even ash falling from the sky in eastern North Carolina. The Great Lake Fire ignited in Croatan National Forest on April 19 and produced a plume of smoke that affected areas from New Bern northward.
During that short-lived smoke event before weekend rains helped contain the fire, NC DAQ’s monitors in Northampton County and Pitt County measured maximum 1-hour PM2.5 concentrations of 94 and 127 micrograms per cubic meter, respectively. Both were well within the Code Red range, although their daily average concentrations were only Code Yellow. Locations closer to the fire likely did experience Code Red or worse conditions.
Code Red AQI days are rare in North Carolina. The last time daily average PM2.5 concentrations reached or exceeded that level of particle pollution across a large area of the state was during the wildfires in November 2016 in Charlotte and much of western North Carolina.
In eastern North Carolina, the last Code Red or worse event – prior to the Great Lake Fire – due to PM2.5 levels was likely in June 2011, when smoke from the Pains Bay fire burning along our coast pushed inland. Finally, many areas also had Code Red ozone concentrations on June 29, 2012, associated with a hot, polluted air mass moving in from the west.
While days with unhealthy ozone conditions are much rarer now than they used to be, we continue to face the threat of elevated PM2.5 levels during exceptional events like these, and that is expected to continue in the future. While climate change does not directly cause fires, it exacerbates the conditions that make fires more likely, whether that’s 90-degree May days in northern Canada that help their boreal forests ignite and burn over wide areas, or — as the North Carolina Climate Science Report notes — stretches of warmer and drier conditions in our own shoulder seasons, as we saw at the coast this spring.
Although our day-to-day air quality conditions have undoubtedly improved, this spring and early summer have reminded us that under the right conditions – including fires burning within our state, or more than a thousand miles away – unhealthy air quality is still possible in North Carolina.