Cool and at times smoky conditions continued in June, while a week of showers and storms reversed the dry pattern we started the month with. We also look at the numbers after the first half of 2023, and preview the main storylines for the end of the year.
Spared from Summer Heat, but Not Smoke
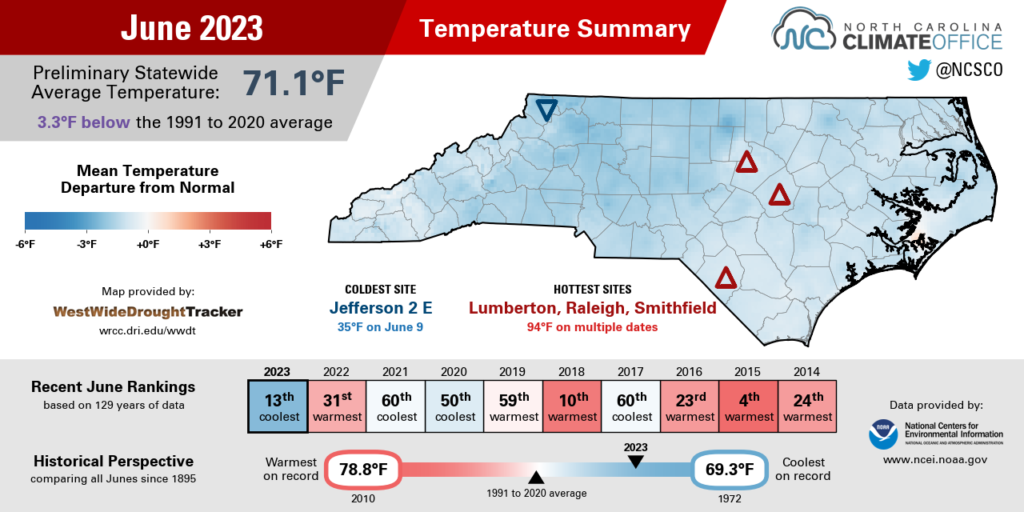
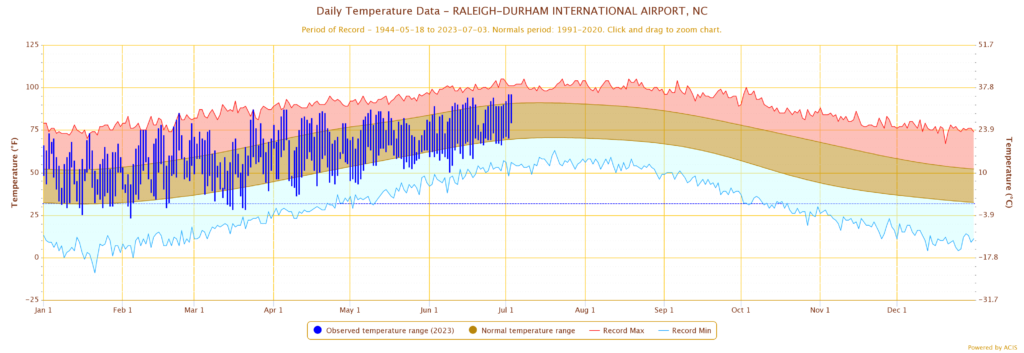
Our unseasonably cool start to summer continued last month, as the National Centers for Environmental Information (NCEI) reports a statewide average temperature of 71.1°F and our 13th-coolest June out of the past 129 years.
Our June weather was largely shaped by the same factors as in May, with upper-level troughing over the eastern United States that kept us cooler amid prevailing northerly or northwesterly winds.
Meanwhile, the culprit behind our normally sticky summer weather – the Bermuda high pressure system, which tends to usher in hot and humid air from the south – was well offshore for most of last month.
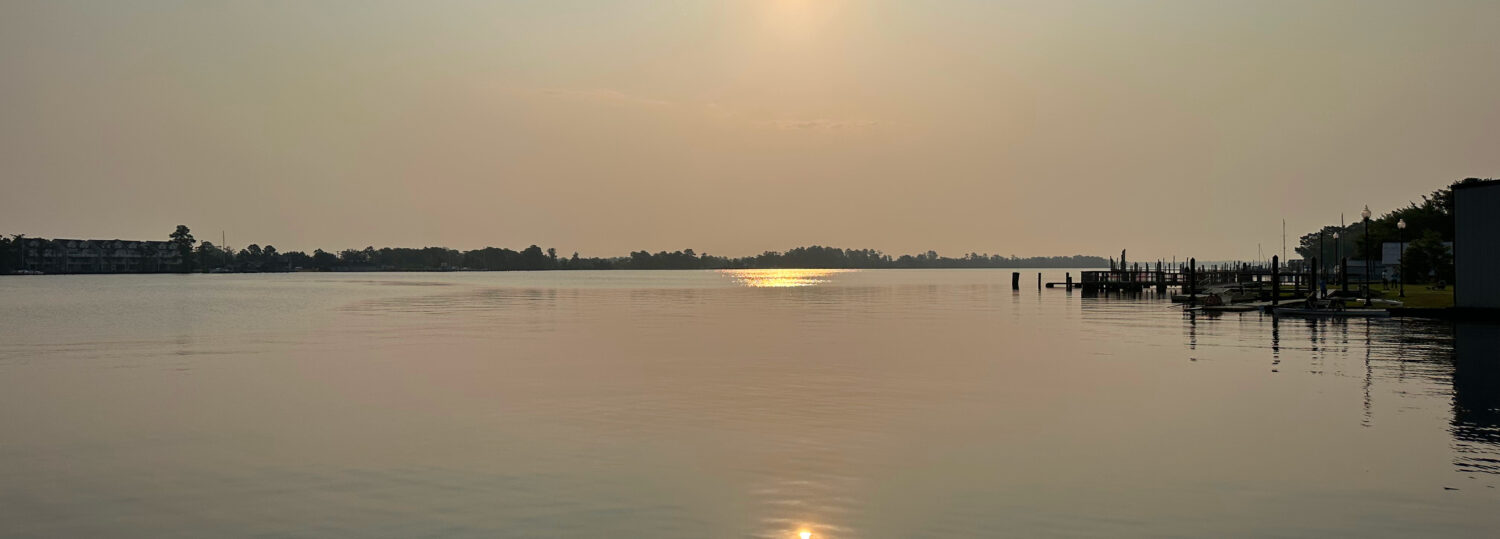
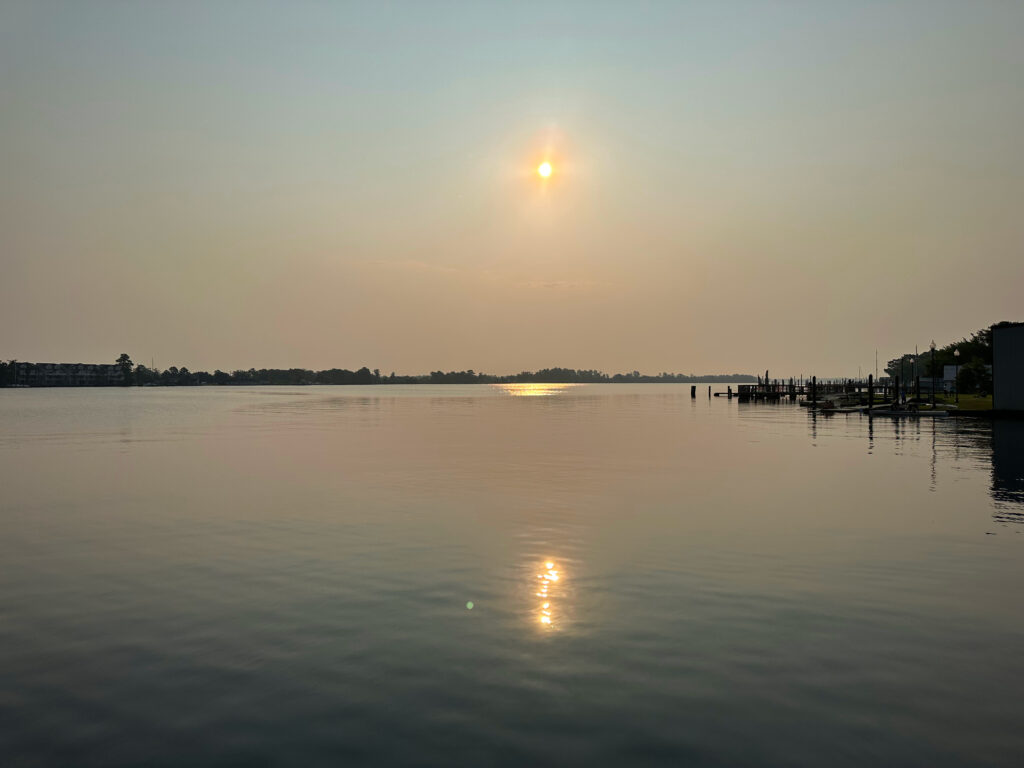
The cooler upper-level pattern had an unfortunate side effect of funneling in smoke from Canadian wildfires during the second week of the month, and again in its final days. Raleigh’s Millbrook monitor recorded four days all month in the Code Orange range. The last time that happened was in July 2012 due to persistently high ozone concentrations.
Last month on June 29, the daily average PM2.5 concentration in Winston-Salem was in the Code Red, or Unhealthy, range. That was the first Code Red day there since June 29 and 30, 2012, due to elevated ozone levels, and the first Code Red day for fine particulate matter since June 13, 2008, when smoke pushed inland from the Evans Road fire burning in eastern North Carolina.
A fire burning closer to home also created some air quality concerns at the southern coast. The Pulp Road fire burned more than 15,000 acres at the Green Swamp Preserve, which prompted Code Red air quality forecasts for Brunswick County and produced hourly PM2.5 concentrations at Code Red levels in Wilmington.
While the air wasn’t exactly fair for much of June, it was rare for this time of year. Easterly areas such as Greenville and Tarboro didn’t hit 90°F until June 26, which was the latest first occurrence for both sites in more than a century. And areas such as Greensboro and Statesville had yet to hit the 90-degree mark by the end of June, compared to almost a dozen days that warm through this point last year.
In fact, it was the coolest June on record for sites such as Statesville, Concord, and Mount Airy dating back 90 years or more, while Greensboro tied for its 7th-coolest June and the coolest since 1997. Elsewhere, it was the 9th-coolest June for Elizabeth City, Chapel Hill, and Monroe, and the 4th-coolest for Highlands, Marshall, and Monroe in the Mountains.
Rain and Flooding Arrives Late
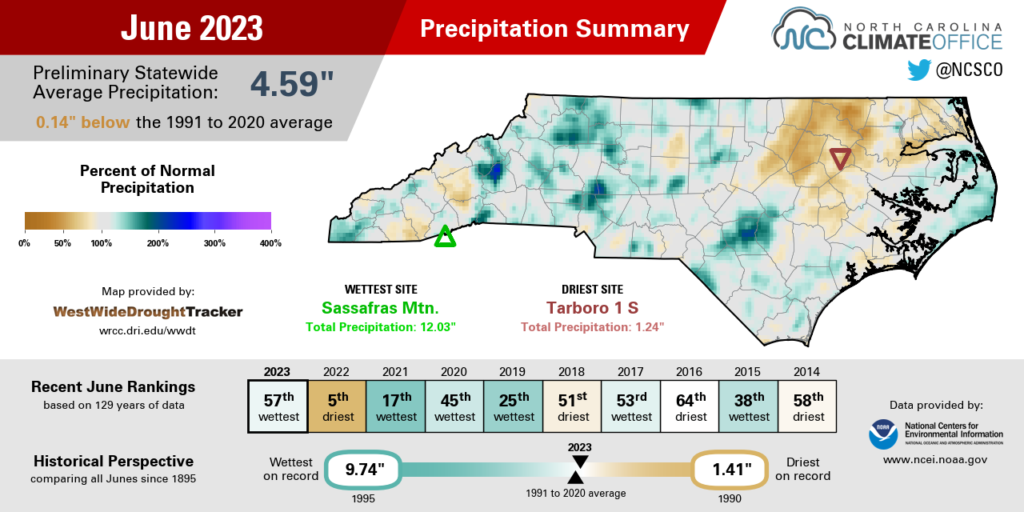
Dry weather in early June was tamped down by a wet week late in the month, and it finished as slightly wetter than average overall. NCEI reports a statewide average precipitation of 4.59 inches, which ranks as the 57th-wettest June since 1895.
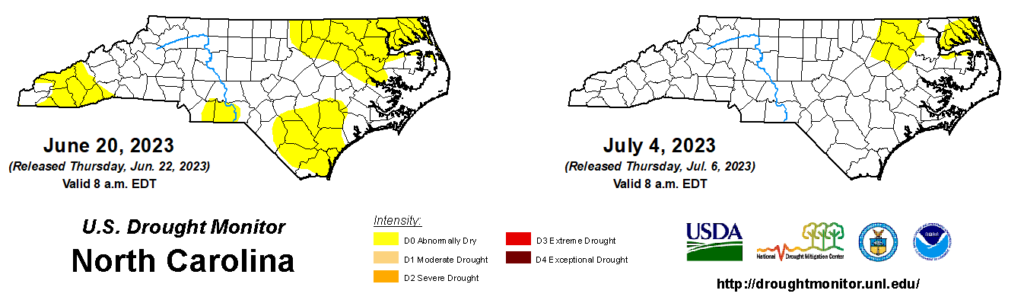
Showers were scarce early on, and Raleigh had received only 0.06 inches of rain through the midpoint of the month. While the cooler temperatures limited losses from evaporation, the lack of rainfall still helped Abnormally Dry (D0) conditions emerge and expand across all three regions of the state.
But the rains arrived en masse by June 19 as an upper-level low pressure system parked over us, kicking off five days of heavy rain across much of the state.
Weekly totals peaked at 11.01 inches on Sassafras Mountain along the South Carolina border. Our ECONet station on Mount Mitchell had 9.44 inches over the same 7-day period ending on June 25, including 4.19 inches on June 20 – the wettest single day there since November 11 last year when the remnants of Hurricane Nicole moved through.
Those extreme rain amounts led to flooding in McDowell County, washed-out roads in Polk County, and high water in Kannapolis that required 30 people to evacuate from their flooded homes.
Our wet end to June also featured severe thunderstorms. On June 23, an EF-1 tornado damaged several buildings in Kinston, and on June 26, hail up to 2 inches in diameter – the size of hen eggs – fell near Lexington and Mocksville.
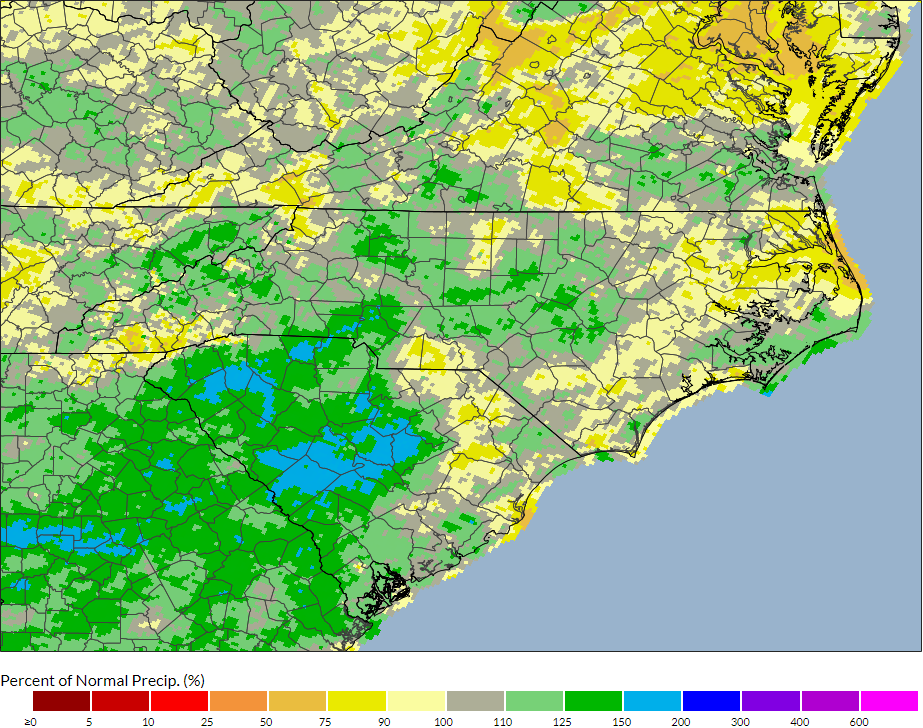
Drenched by rain and pelted by hail, the western Piedmont and central Mountains were the wettest spots last month, picking up more than six inches of rain in total. The 9.54 inches in Wilkesboro at the W. Kerr Scott Reservoir was the most in any June since 1965, while Beech Mountain had 6.93 inches and its 5th-wettest June since 1991.
The northern Coastal Plain didn’t see as much rain and finished June drier than normal. Tarboro had 1.24 inches and its 4th-driest June on record, while Roanoke Rapids measured just 1.68 inches all month.
As a result, the current US Drought Monitor map shows a few lingering pockets of Abnormally Dry conditions in the northeastern corner of the state. In those areas, some streams in the Tar, Roanoke, and Chowan river basins continue to run below normal levels.
A Year-to-Date Update
It may be surprising given the two cool months in a row, but through the midway point of the year, the story of 2023 so far is prevailing warmth. According to data from NCEI, we’re still on pace for our 5th-warmest year on record statewide, 1.76°F warmer than the 1991 to 2020 average and less than a degree behind the warmest year to this point in 2017.
Locally, both Greenville and Wilmington have had their 2nd-warmest start to a year on record, while Hickory is tied for its 4th-warmest January through June, and Charlotte has had its 6th-warmest first six months of a year.
How are those high rankings possible given the decidedly unseasonable start to summer? Well, the first four months of the year were even more unseasonable in the other direction. Recall the snowless winter for most areas that featured few cool days after our Christmas cold snap, and the sneaky warm spring, when pollen filled the air and flowers were in bloom up to a month earlier than normal.
Over the past two months, our average temperatures have generally been 3 to 4 degrees below normal, but earlier this year, the departures were much greater than that on the warm side. February was 6.7°F warmer than normal, and those 80-degree days at the end of the month were more than 27 degrees above normal in some spots.
Our precipitation ranking reflects a generally balanced start to the year. On average across the state, we’ve received 24.23 inches so far in 2023, which is 0.21 inches above the recent 30-year normal and our 64th-wettest first six months out of the past 129 years.
Among the wet spots compared to their average precipitation, Greensboro is 2.63 inches above normal with its 35th-wettest start to a year dating back 120 years, and Hatteras is 3.54 inches above normal with its 21st-wettest January through June since 1893.
Parts of the southern Mountains have been a bit drier than normal, including Asheville (-3.50 inches) and Franklin (-5.39 inches). The northeast has also been on the dry side, with Elizabeth City recording only 16.28 inches so far – 5.03 inches below normal – and its 11th-driest start to a year since 1934.
Second-Half Storylines for July and Beyond
Looking ahead to the rest of 2023, here are three key questions that will help determine how the year shapes up in North Carolina.
How long will summer swelter? July – our climatological hottest month of the year – has gotten off to a warm start, with the first 90-degree days of the year in the Triad and record-setting nighttime lows in the Triangle. So is this the delayed and dreaded beginning of the dog days of summer, or just a brief warm-up amid a prevailing cooler pattern?
The current three-month outlook from the Climate Prediction Center shows above-normal temperatures are likely for most of North Carolina from July through September, which suggests summer may be here to stay.
Will the hurricane season be front-loaded? While we’ve been cool here at home, sea surface temperatures across the Atlantic’s main development region have risen to record warm levels for this point in the season. That helped tropical storms Bret and Cindy develop unusually far east last month.
With such favorable conditions in place and the water continuing to warm up, we could see even more activity in the Atlantic between now and the peak of the season in mid-September. That would be a far cry from last year, when we went almost two months in July and August without any named storms.
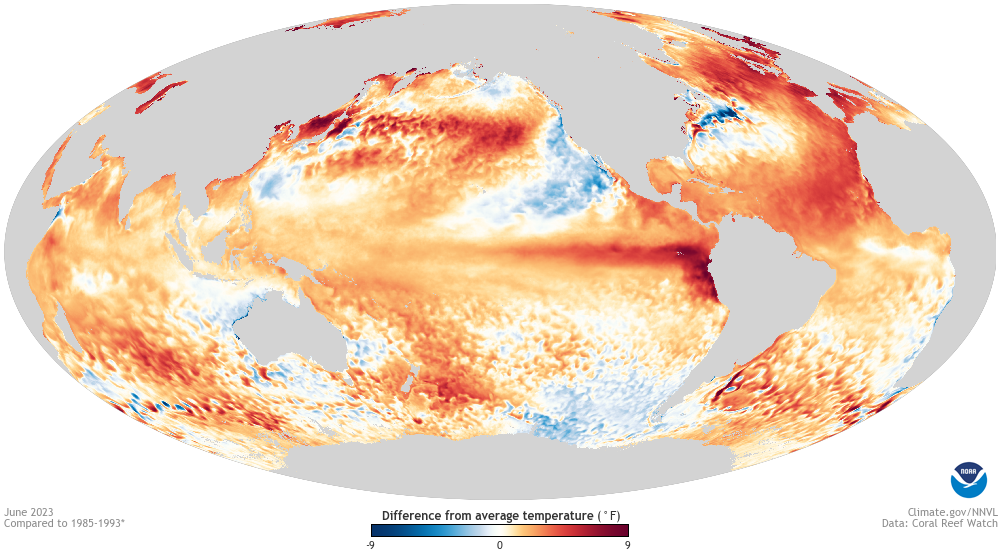
What will El Niño mean for us? Warm water is also building in the Pacific Ocean as part of a developing El Niño, and some forecasts show it becoming quite strong later this year. As the effects of that El Niño begin to ripple through the atmosphere, one potential impact could be increasing vertical wind shear across the Atlantic and an eventual reduction in tropical activity. During the last strong El Niño in 2015, only three named storms formed after the midpoint of the season, and once the 1997 El Niño emerged, just two storms formed after September 4.
By mid to late fall, we could see more direct impacts on our local weather through a strengthening of the subtropical jet stream that would begin to bring more moisture-rich weather systems in from the Gulf of Mexico or up the Atlantic coastline.
We’ve avoided any widespread drought so far this year thanks to soaking rain events like the one late last month. However, if any areas do begin to dry out later this summer – particularly if hotter weather sticks around – then we’ll likely look to that El Niño-induced pattern for rainfall relief later this year.
And if we don’t dry out, then we could be in for a soggy second half of 2023, between the potential for tropical storms in a warm Atlantic and the impending El Niño.