Between torrential flood-causing rainfall and warm, humid weather, it was an active and often uncomfortable May weather-wise. Our latest climate summary takes a look at the past month in North Carolina, including an interesting observation from one of our stations.
Record-Setting Rainfall
This year’s April showers continued into May, as widespread rainfall produced our wettest May on record dating back to 1895. The preliminary statewide average precipitation was 8.34 inches — more than double the 1981-2010 average of 3.86 inches, and a half-inch more than the previous record from May 1901.
A number of weather stations around the state also reported record-breaking May rainfall. Along the coast, Wilmington (14.36 inches) had its wettest May dating back 145 years.
It was an even wetter month in the southern Mountains, where loads of moisture from the Gulf of Mexico — including some brought in by the landfalling Subtropical Storm Alberto — doused the region with more than a foot of rainfall.
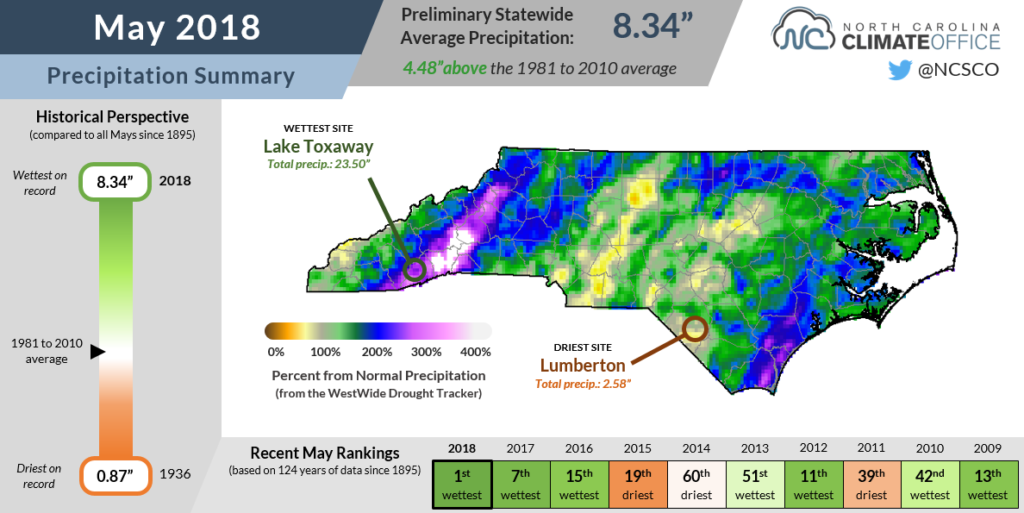
Pisgah Forest (18.75 inches) and nearby Brevard (17.90 inches) both recorded their wettest Mays on record, and clouds rising up the slopes of Mount Mitchell (20.77 inches) produced its wettest May and third-wettest month since 1980.
One of the climatologically driest spots in the state — Asheville — was among our wettest locales last month. With 14.68 inches of precipitation, the Asheville Airport recorded its wettest month ever based on records that extend back 150 years, beating the 13.75 inches from August 1940.
The heavy rains in the Mountains caused streets to flood, rivers to swell, and landslides that resulted in 2 deaths and threatened to fail the Lake Tahoma dam. The damages were reminiscent of September 2004, when back-to-back tropical storms inundated the region.
While drought is the last thing on the minds of many in the state right now, a few counties in the southern Coastal Plain remain classified as Abnormally Dry by the US Drought Monitor.
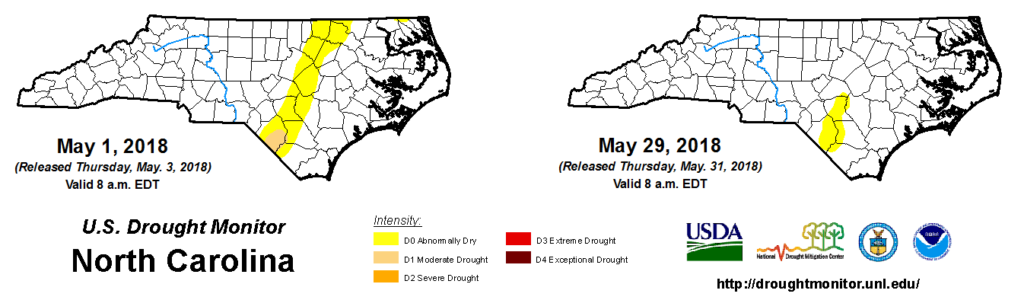
May brought near-normal rainfall to those parts of Bladen, Cumberland, and Robeson counties that led to the removal of Moderate Drought, but they’re still in a deficit dating back to the start of the winter. Over the past six months, Fayetteville is 2.3 inches below normal and Lumberton is 2.5 inches shy of its normal precipitation.
If our wet pattern continues — and current forecasts expect that it will — the remaining dryness is likely to be short-lived, and as is, we’re set to enter the summer with full reservoirs, near- to above-normal streamflows, and plenty of available soil moisture as the growing season continues.
Summer-Like Heat and Humidity
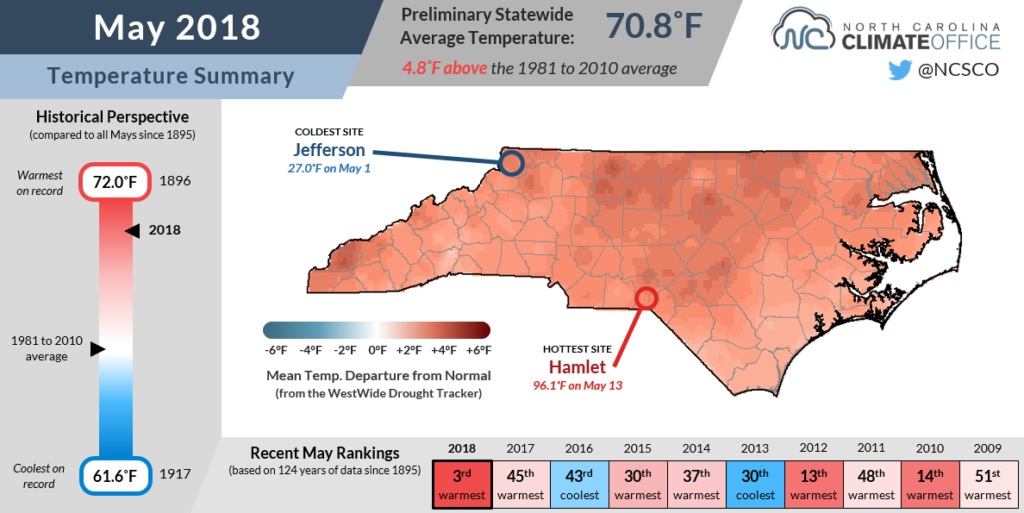
Based on the temperatures alone, you might think that we’re already well into the summer, and the rankings reflect that observation. The statewide average temperature in May of 70.8°F was our 3rd-warmest out of the past 124 years, nearly 5 degrees greater than the 1981-2010 average.
It ranked as the warmest May on record for many sites in the northern Piedmont and Coastal Plain, including Greensboro (warmest since 1903), Raleigh (warmest since 1887), and Greenville (warmest since 1914).
One major factor in our persistent heat was the Bermuda high pressure system, which built in off the Southeast coast and funneled in warm, moist air from the south. The Bermuda high is a common feature of our summertime climate, but it has made its presence felt early and often already this year.
So no, that muggy weather wasn’t just in your imagination. As the table to the right shows, our average dew points — which capture both the heat and the humidity of the atmosphere — also set records, generally beating the previous highest May values by more than 2 degrees.
| Location | May 2018 Avg. Dew Point | Previous May Record (Year) |
|---|---|---|
| Hatteras | 68.6°F | 65.5°F (2004) |
| Wilmington | 66.6°F | 66.2°F (1991) |
| Raleigh | 65.6°F | 63.1°F (2004) |
| Charlotte | 64.9°F | 62.2°F (1991) |
| Greensboro | 64.0°F | 62.0°F (1975) |
| Asheville | 61.8°F | 59.3°F (1991) |
The humidity doesn’t just make it feel sticky outside. It can also be detrimental to crops. Gary Cross, a Person County extension agent, explained in a recent USDA Weather & Crops Report how the recent weather has provided a bit too much of a good thing — namely, moisture:
Wet conditions [and] excessive rain [have been] good for all crops, but the rain is coming in heavy downpours and running off. Wet, humid conditions will promote disease in wheat, soybeans, [and] tobacco.
The recent rains have also made it difficult for farmers to get in the field to plant corn and soybeans, transplant tobacco and vegetables, and pick crops such as strawberries, which were reported to have a good yield in the northern Piedmont.
A Weather Data Mystery
Last month, we noticed something strange in the solar radiation data from our Reidsville ECONet station. Every afternoon around 2 o’clock, the radiation values abruptly dropped, even if it was completely sunny outside.
A few hours later, just as quickly as they had dropped off, the values from both the solar radiation sensor and photosynthetically active radiation (PAR) sensor suddenly increased for the final few hours of the day.
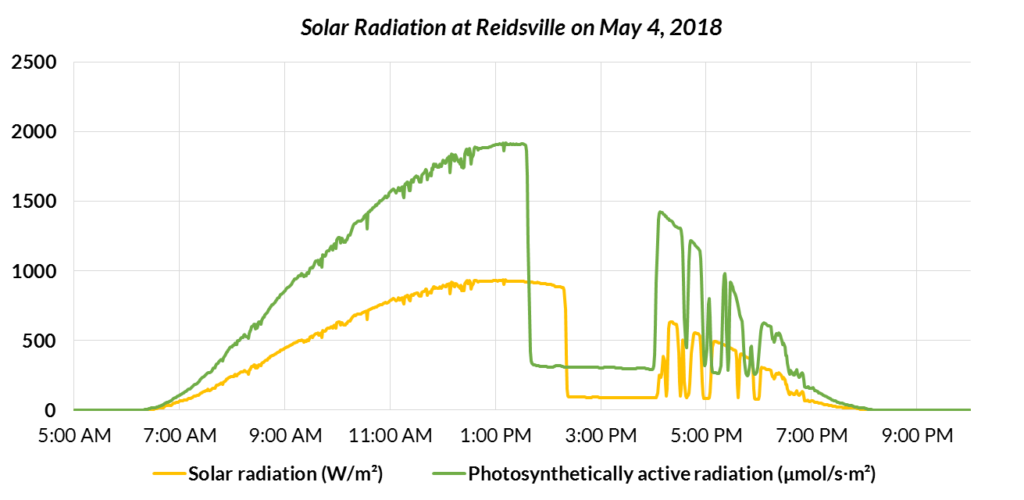
So what was going on? Was there a solar eclipse happening only over Reidsville every afternoon?
No, but a similar effect was at play. Rather than the moon casting a shadow on the earth’s surface, some obstruction was casting a shadow on the radiation sensors. Because there are no trees are buildings within a few hundred feet of our Reidsville station, we knew the obstruction had to be on the tower itself.
When we arrived at the station a few weeks ago, we discovered the culprit. Around noon, the shadow from our cellular antenna was creeping ever closer to the radiation sensors. Within a few hours, they’d be in for another afternoon of artificial shade.
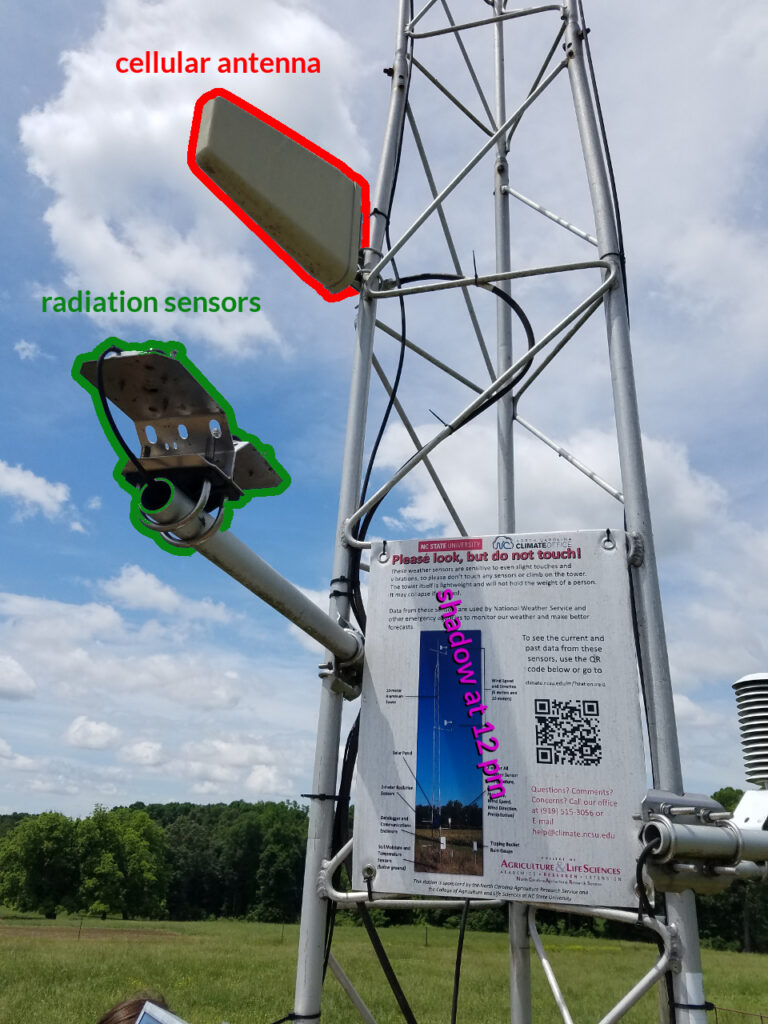
To avoid that, we re-positioned the antenna so it’s pointed in nearly the opposite direction. At some of our more remote stations, that might make it difficult for the signal to reach a nearby cell tower. Fortunately, the Reidsville site is adjacent to several such towers, so it was a quick and easy fix for a rather unusual-looking characteristic of that station’s data.
It also showed the utility of the quality control procedures we run on our data each day. Because the radiation values were within a realistic range — with clouds overhead, solar radiation can decrease during daytime hours — it would have been easy to miss the issue. However, we also compare values between the solar radiation and PAR sensors to make sure the ratio between the two is realistic.
Because one sensor’s values were dropping about 45 minutes earlier than the other, our quality control check flagged the data as potentially bad, and we were able to identify the problem and get out to fix it before any suspicions arose around Reidsville about strange solar occurrences in the skies overhead.