This month’s climate summary highlights our turbulent March that included some springtime snow, cool and windy weather, and a new sensor to help track heat stress on the human body.
Spring Starts with Snow, Variable Rainfall
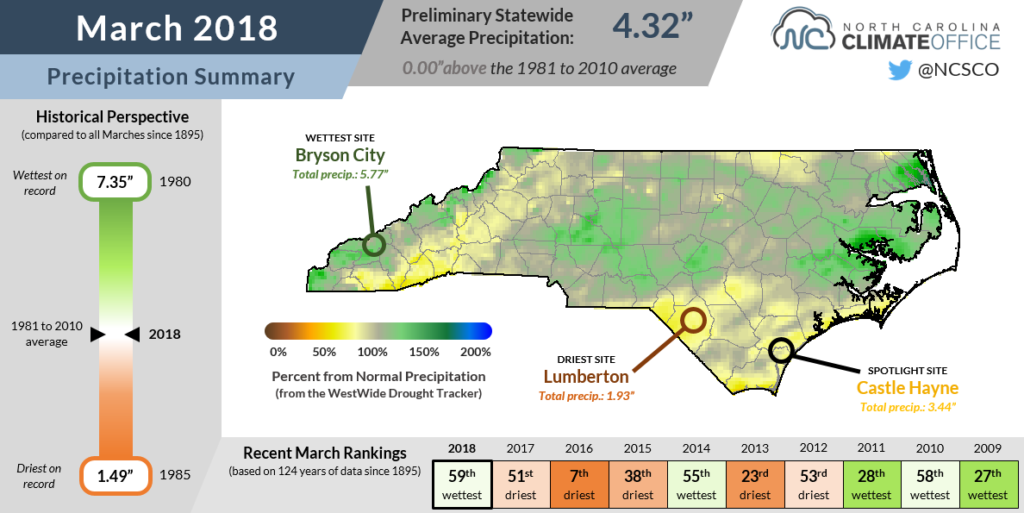
In March, some parts of North Carolina received drought-relieving rain and snow while others saw more limited precipitation. Overall, it was a slightly drier-than-normal month, and the preliminary statewide average precipitation of 2.98 inches ranks as the 25th-driest March since 1895.
The bulk of the frozen precipitation fell across the northern Piedmont during events on March 12 and March 24-25. As we discussed in our recent Winter Recap blog post, snow in March isn’t unusual, but snow that late in March definitely is.
With a total precipitation of 5.3 inches, Reidsville recorded its 7th-wettest March out of the past 54 years. In March alone, that site received 9.9 inches of snow — one inch above the annual average. Reidsville’s seasonal snow total of 22.4 inches is the most there since 1988-89.
Those above-normal precipitation totals across the northern and western Piedmont helped remove Moderate Drought (D1) conditions along the Virginia border and Abnormally Dry conditions from the Yadkin Valley. Locations where Abnormally Dry conditions remain in the Piedmont still have some longer-term precipitation deficits dating back to last fall.
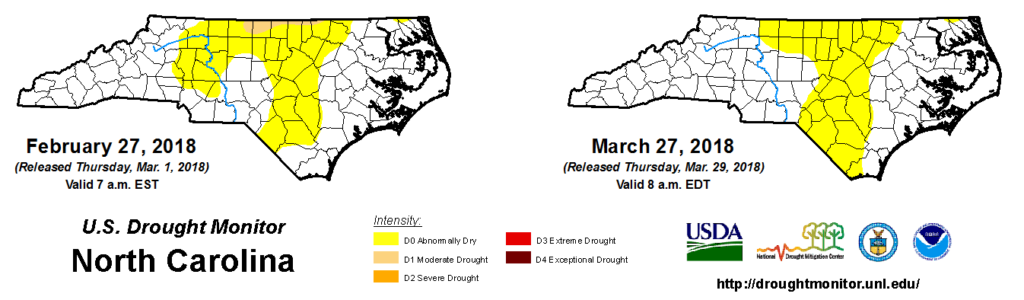
It was a bit drier and decidedly less snowy in the eastern part of the state. With limited rainfall across the Sandhills and southern Coastal Plain, Abnormally Dry conditions expanded there as streamflows and soil moisture levels began to decline. Laurinburg reported only 1.95 inches of precipitation, making it the 12th-driest March there in the past 69 years.
Our spotlight site in Castle Hayne near Wilmington is not in Abnormally Dry conditions thanks in part to a near-normal March precipitation total of 3.44 inches. However, other parts of the Coastal Plain have been showing signs of slowly drying out, which could accelerate as temperatures begin to climb this spring.
Tumbled Temperatures and Whipped-Up Winds
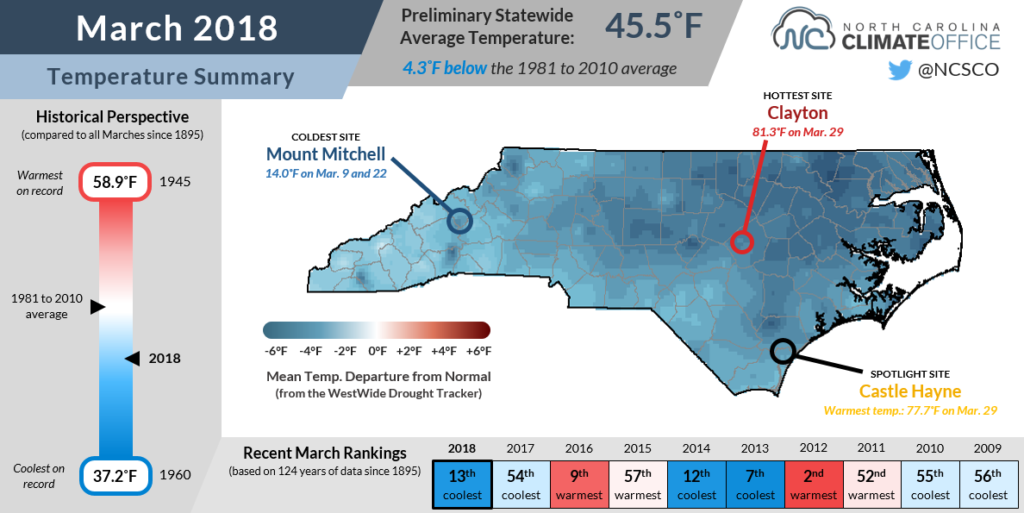
After February’s unseasonable warmth, March rebounded with a surge of winter-like cool weather. The preliminary statewide average temperature of 47.9°F, nearly 2 degrees cooler than the 1981 to 2010 average, ranks as the 40th-coolest March out of the past 124 years.
Our average low temperatures in March are generally in the mid- to upper-30s. However, last month, most of the Mountains and Piedmont saw a dozen or more days with lows at or below freezing.
Mount Mitchell had an amazing 26 days with temperatures at or below freezing, tied with 1999 for the most in March based on records going back 39 years. Even along the coast, New Bern had 10 days with lows dropping to freezing or lower, which was tied for 4th-most out of the past 63 years, and the most since 1993.
If it felt even colder than the rankings suggest last month, it could be because it was a windy month. Greensboro reported an average hourly wind speed of 9.7 mph — the 13th-highest March average out of the past 70 years, and the highest since 1996. Asheville had a similar average of 9.8 mph, which also ranked as the 13th-highest since hourly records began in 1948.
At our spotlight site in Castle Hayne, the monthly average temperature of 49.9°F ranks as the 4th-coolest out of the past 29 years. As the next section highlights, the temperature measurements at Castle Hayne and three of our other ECONet stations received some attention last month.
A New Spin on Measuring Heat Stress
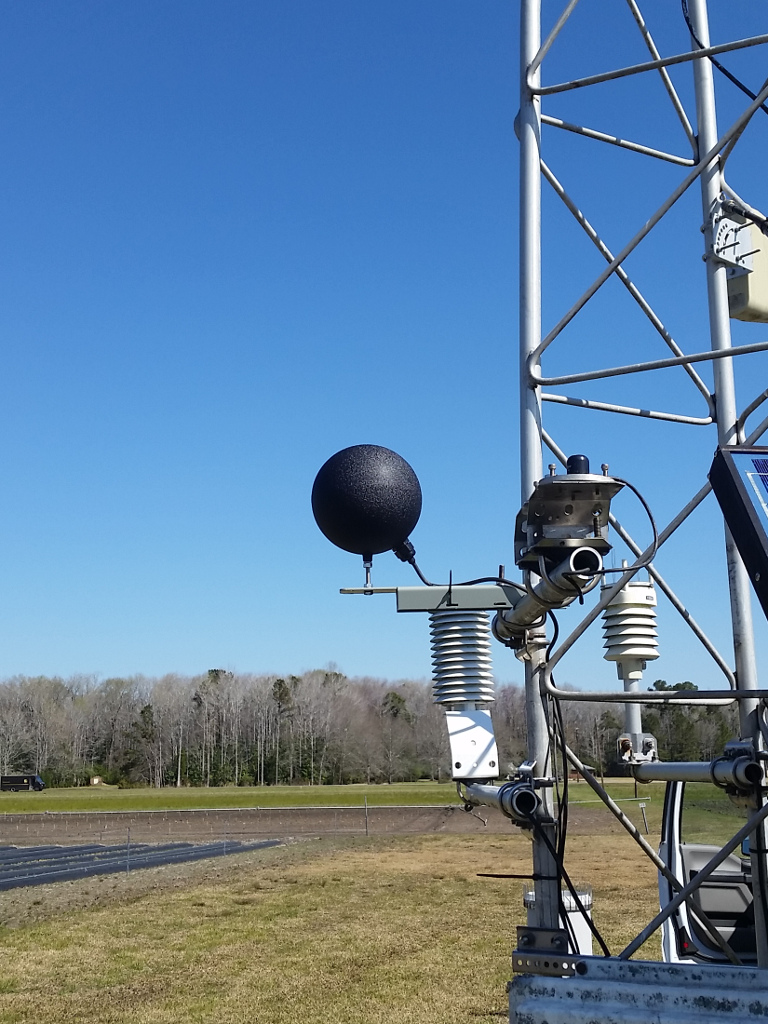
We recently installed black globe thermometers at our ECONet stations in Castle Hayne, Bahama, Goldsboro, and Rocky Mount. Black globe thermometers are comprised of hollow spheres with a thermistor (or type of thermometer) located in the middle. While the sphere is primarily copper, it is painted black to better absorb radiant heat.
If you’ve been unfortunate enough to wear a dark-colored shirt on a sunny day, then you know it causes a bit more heat stress on your body. The overall environmental stress due to the heat can be modeled by a parameter called the wet bulb globe temperature, or WBGT.
The WBGT calculation includes the dry bulb air temperature to account for ambient heat, the wet bulb temperature to account for evaporative heat, and the black globe temperature to account for radiative heat.
The main advantage to using WBGT over something like the heat index is that it factors in sunlight and wind. As we head into the summer and the amount of incoming solar radiation increases, the WBGT will provide a better representation for how heat affects the human body.
This means it can also be used to determine how long it’s safe to be outdoors. For example, if the WBGT is between 85°F and 88°F, then we begin to feel heat stress after 30 minutes of working or exercising in the sun.
We plan to install black globe thermometers at four more weather stations in our network over the next month, and eventually, we hope to have these sensors at all 41 of our stations.
We have also been working with the Southeast Regional Climate Center in recent months on a tool showing estimates of WBGT based on past, current, and forecast gridded weather data. Our on-the-ground observations will be used to evaluate this tool and make adjustments over time.
As we collect this WBGT data, it will be useful for the National Weather Service and emergency managers to determine the risk of heat-related incidents, for the agricultural community as they consider cattle heat stress, and for the general public to see just how hot it feels outside.