Summer Projects: Hitting Pay Dirt on Soil Moisture
This post is part of a series highlighting the summer projects from our office’s student research assistants. This part of the series is written by Andrew Henderson, who is a rising junior majoring in Meteorology at North Carolina State University.
Soil moisture plays a vital role in agriculture, meteorology, and drought-monitoring. Simply defined, soil moisture is the amount of water contained within a specified volume of soil. The amount of soil moisture in the soil is driven largely by precipitation, and there are numerous sensors that measure this response.
Although it seems logical all soil moisture sensors should respond to changes in soil moisture the same way, differences in soil moisture sensor models, tendencies, behaviors, and costs do not necessarily make this true. For instance, one soil moisture sensor may consistently report higher values than another, even if they are only inches apart in the soil.
So which model of soil moisture sensor is the best? Do less expensive soil moisture sensors perform as well as expensive sensors? In an attempt to answer these questions, an experiment was conducted inside (and outside) of the State Climate Office this summer.
Soil moisture sensors work by emitting tiny electrical pulses that create an electromagnetic field, which energize water molecules in the soil. The return pulse received by the sensor is directly related to the amount of water present in the soil, so the greater the return voltage, the higher the soil moisture.
We measure soil moisture as the percentage of water present, so a value of 0.5 would indicate that 50% of the composition of the soil is water. Soil moisture values between 0.4 and 0.5 indicate moist soil, while any value below 0.1 represents dry soil. Different soil types have different typical soil moisture values. For example, the sandy soils common in eastern North Carolina generally have lower soil moisture levels than loamy or clay soils.
The Experiment
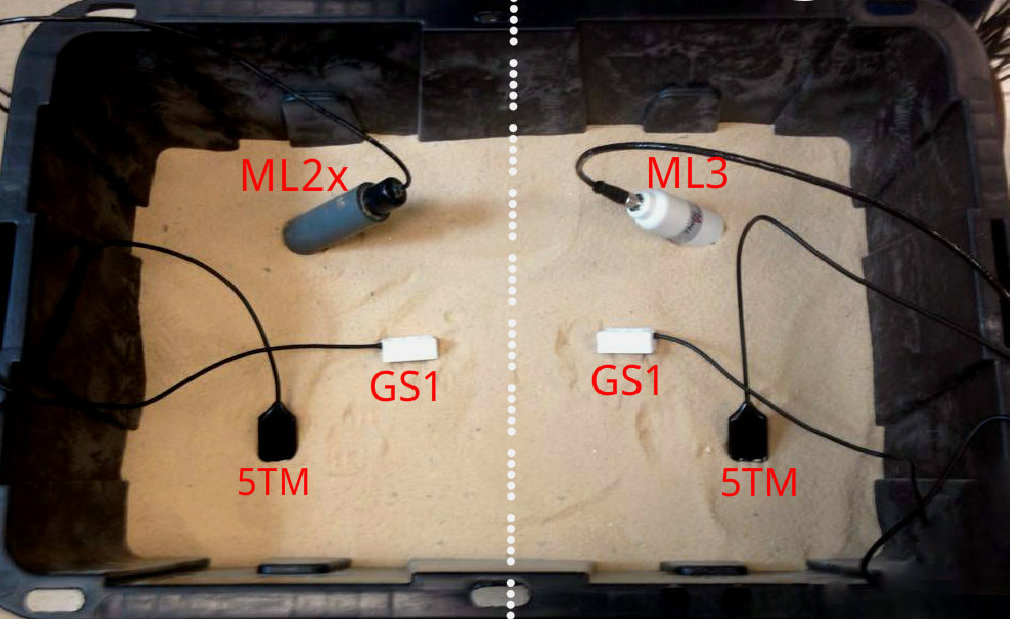
To observe how various models of soil moisture sensors responded to precipitation, we placed sensors in bins filled with sand and topsoil, then subjected them to indoor and outdoor environments over a two-month period this summer.
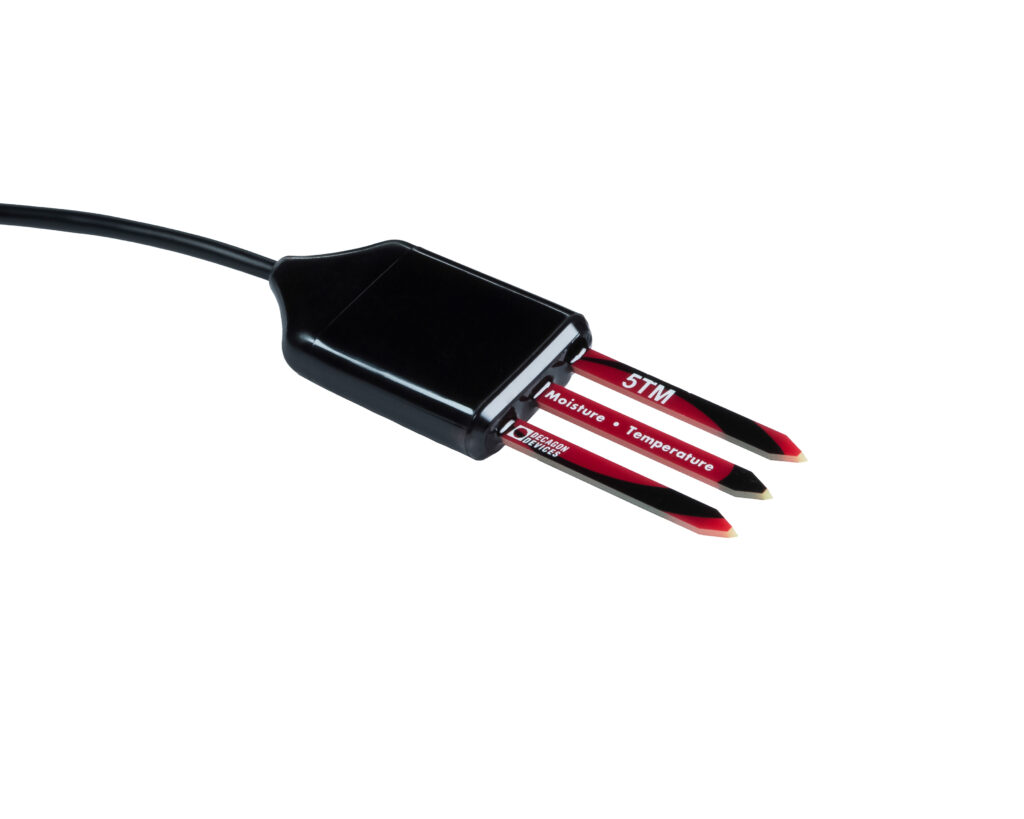
We tested four different soil moisture sensors, all of which were placed at a depth of eight inches beneath the surface. On both the left and right sides of each bin, we placed Decagon 5TM and GS1 sensors, which at a cost of $115 and about $100 respectively are less expensive options. For comparison purposes, we tested Delta-T ML2x and ML3 probes, which are more expensive and therefore expected to provide a fairly accurate measure of soil moisture content.
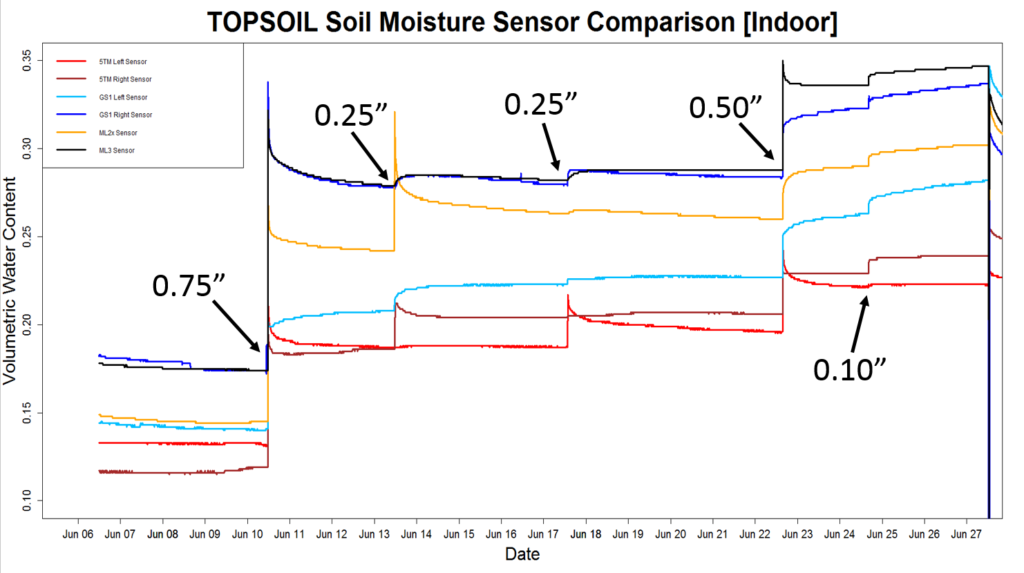
For three weeks in June, we conducted our experiment indoors to see how the soil moisture sensors responded in a controlled environment. At five specific times, we added water equating to various precipitation amounts — 0.10 inches, 0.25 inches, 0.50 inches, and 0.75 inches — to both bins to see how the sensors responded to these simulated rainfall events. The water was measured and dispersed by hand into each of the bins using a 4″ diameter CoCoRaHS gauge.
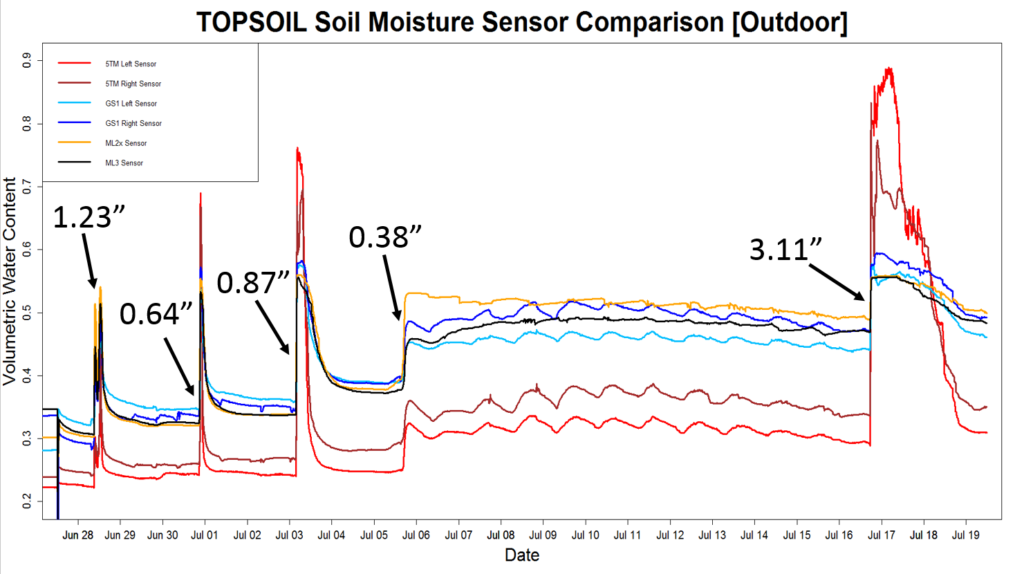
In July, we moved the experiment outdoors and open to the mercy of the weather. For the first two weeks, daily showers and thunderstorms resulted in consistently high soil moisture levels. The middle of the month was drier, which caused the sandy soil to gradually dry out while the topsoil moisture content stayed relatively constant. Both soil types tended to dry out when the weather was warmest during the day and moisten overnight, but this effect was most prominent in the topsoil. Finally, a significant rainfall event on the night of July 16 led to a spike in soil moisture values.
The response curves of the different sensors for both the indoor and outdoor portions of the experiment are shown below.
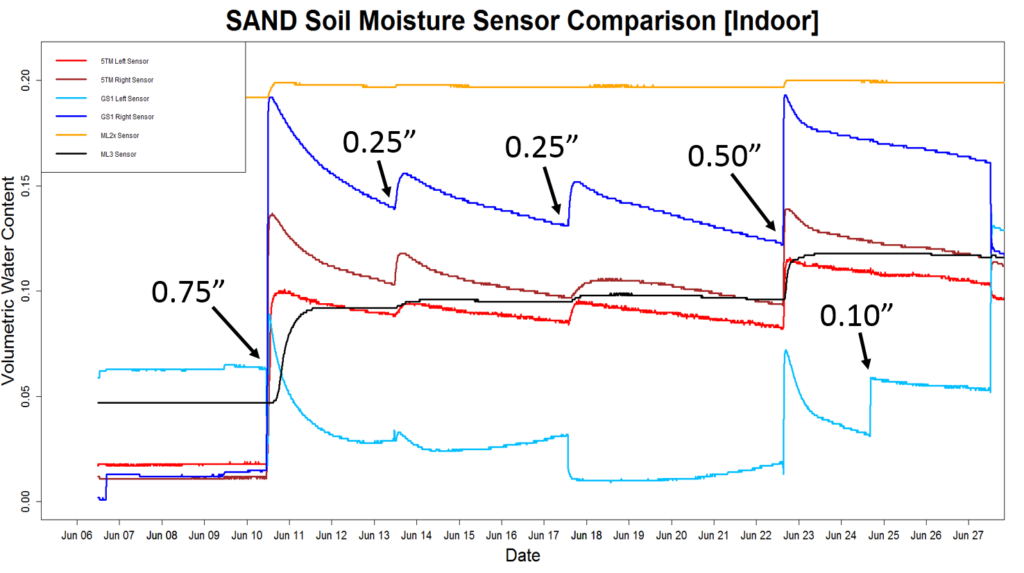
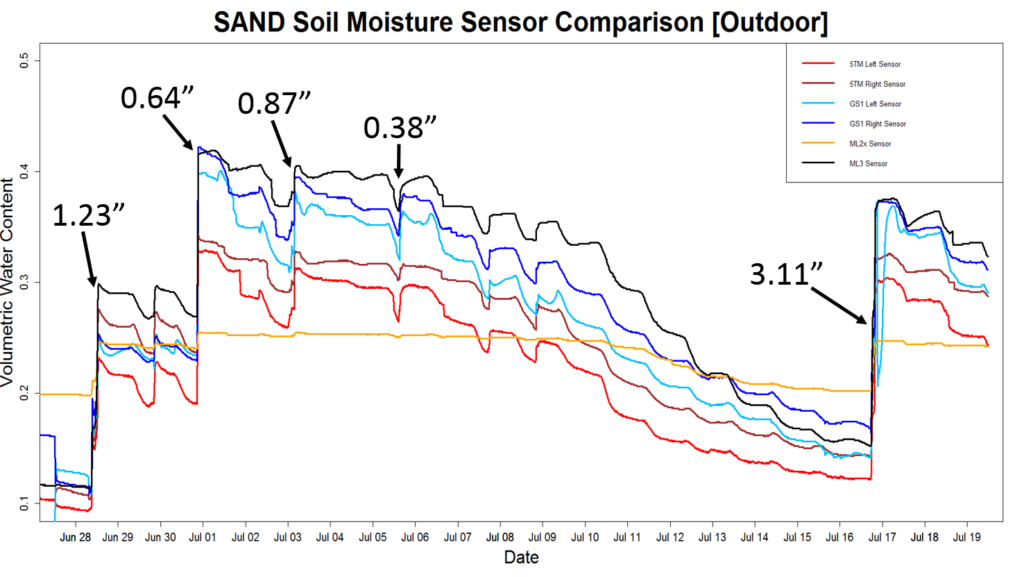
Note that the ML2x sensor in the sand bin (orange line) was a sensor that was removed from an operational ECONet site after it began reporting strange values. It was suspected of being a faulty sensor, and our experiment confirmed the initial diagnosis that the sensor was not measuring soil moisture correctly.
The Results
This experiment resulted in a two-month long time series of soil moisture data that is useful in distinguishing trends among the four different soil moisture sensors. Knowing that the ML3 soil moisture sensor (black line) is the most expensive sensor, we used the ML3 as the control, or standard, for this experiment. If we compare the response curves of all of the other soil moisture sensors to the ML3, we immediately notice two things: the spread of the data between these six soil moisture sensors is very large, and some sensors have tendencies to consistently measure higher or lower than the ML3.
A primary objective of the experiment was to observe if each of the sensors responded similarly given a uniform amount of rainfall. This proved to be true, and all of the sensors reacted alike, only maintaining minor variations in response time and magnitude. In this case, the less expensive soil moisture sensors performed at the same level as the more expensive sensors. Despite a few calibration discrepancies leading to some sensors consistently measuring high or low, all of the soil moisture sensors responded alike when precipitation occurred.
As shown in the outdoor response curves, solar radiation, shadows, precipitation intensity, and wind can play a significant role in affecting the soil moisture levels. This project is still ongoing, and future work includes analyzing how each of these parameters may contribute to changes in soil moisture. In addition, plans are in place to observe how vegetation affects soil moisture, and to have another period of soil moisture collection data over the winter months.
- Categories:


