Summer Projects: Verifying Winter Precipitation Type Forecasts

This post is part of a series highlighting the summer projects from our office’s undergraduate research assistants. This post is by Samuel Roback, who is currently a senior in the meteorology program at NC State University.
Roads blocked, abandoned vehicles everywhere, cars on fire, people walking for hours just to get back to their homes in driving snow. These scenes are all too familiar in North Carolina when snow begins to fall and quickly accumulates while people are out on the roads. These winter storms are complex and can evolve quickly so forecasts are based heavily on computer models.
When we look back on these events, we often wonder whether the models predicted the correct precipitation types and if their forecast temperatures were too cold or too warm. To find out, I looked back at a storm from this past winter and verified the model forecasts with observations made during the event.
Let’s look at some actual statistics for a winter storm that occurred in central North Carolina on February 16-17, 2015. The forecast data came from the SCO’s Weather Research and Forecasting (WRF) model, which is a fairly advanced high-resolution weather prediction model. The mean error of the forecast temperature at ground level as compared to observations from weather stations on the ground can be seen in the image below.
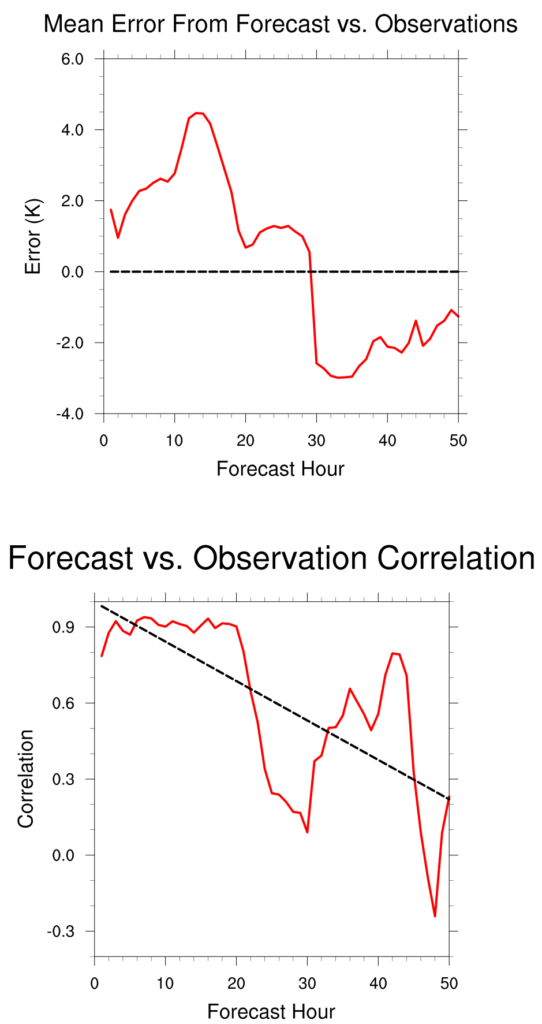
This plot to the left shows the difference between the computer model forecast temperature on the ground and the actual measured temperature on the ground. As you can see, the forecast was too warm during the storm (around 5-20 hours on the plot), which meant forecasters may have expected rain or sleet during the event instead of freezing rain or snow.
Next we’ll look at the correlation, or simply how similar the forecast temperature field was to a field of observations. A correlation close to 1 means the forecast was pretty accurate, while values close to 0 indicate the model forecast did not match the observations.
The high correlation during the storm tells us the models did well at predicting the overall pattern of temperatures, although they were slightly too warm. Of course, as we see with many of our winter storms, the difference of even a degree or two can have big impact on the type of precipitation we receive.
Precipitation type doesn’t depend on surface temperatures alone, though. Temperatures throughout the low levels of the atmosphere are also a key factor. To investigate how well the model forecasted precipitation types, I looked at two methods of calculating them.
First, taking the average temperature of two different levels gives so-called partial thicknesses. Using observations from past events across the state, the National Weather Service office in Raleigh created the so-called TRENDs nomogram, which predicts precipitation type based on these low-level partial thicknesses. I computed thicknesses from the model data and assigned precipitation types based on the nomogram.
Second, a warm nose, or temperature increase, in the low levels can cause the precipitation type to change from snow to sleet, for example. Using the strength of this warm nose, I calculated another estimate of precipitation type for this event.
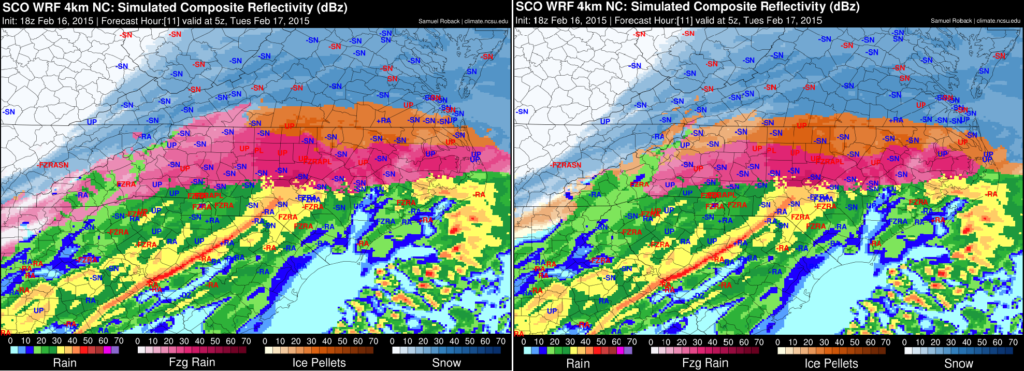
The two maps below show the model forecast radar imagery, color-coded by precipitation type, and observed precipitation type from weather stations at midnight on February 17, 2015. There are slight differences between the warm nose method (left) and the nomogram method (right). For example, the sleet/ice pellet boundary extended slightly farther south in the nomogram method.
Of course, these methods are only as good as the model forecast data, and they cannot compensate for a model warm bias as we saw in this event. For example, stations across the Sandhills and southeastern coast reported light snow or freezing rain falling while both methods predicted rain.
While there will likely always be limitations to forecasting, especially for winter weather, forecasts are constantly becoming more accurate as computer models continue to be improved. These improved forecasts combined with tools such as precipitation type depiction will help create forecasts that can more precisely determine which type of winter precipitation will fall and where.
- Categories:


