They’re the sort of climatological curiosities that may have crossed your mind this year without even realizing it.
In the Sandhills: Wow, 90 degrees before March is done? Here comes the sun!
In the Foothills: A freeze in mid-May? No way!
And in eastern North Carolina last month: Four inches of rain in one day? Don’t float away!
If recent weather has left you wondering about the rarity of such events, or if you’re planning ahead for what sort of conditions you might expect at a different time of year, our relaunched and refreshed Climate Thresholds tool can provide the answers.
The new version of the tool was the work of Mike Rehnberg, an undergraduate intern at the State Climate Office for two years before graduating from NC State University in May. He will begin his graduate studies this fall at the University of Illinois at Urbana-Champaign researching cyclone dynamics.
“What surprised me most was the breadth of information we were able to draw from a single set of raw data just by refining the way we organized that data,” said Mike.
To convert that raw data — historical observations from weather stations across the state — into actionable answers to those climate questions, Mike organized the tool to use a simple three-step process: Select a Threshold, Find a Station, and Explore Data.
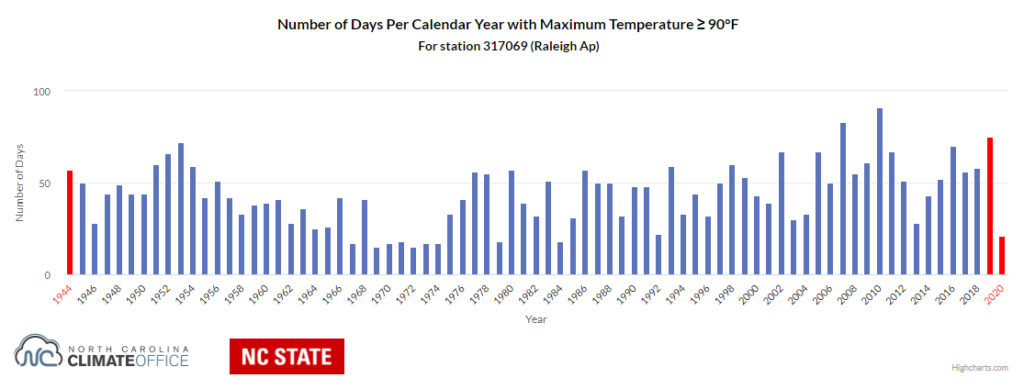
After choosing a threshold of interest — such as days with high temperatures of 90°F or greater — and selecting a weather station with that data available, the results in the final step are presented as key statistics and interactive, exportable charts and tables showing the year-by-year occurrence of days meeting your threshold.
“To me, the biggest application that came out of the tool is its ability to take simple figures and plot their change over time,” Mike said of the charts, which include the number of days per year and the annual first and last days meeting the user-specified threshold at a given station.
Before jumping head-first into the tool, here are some specific examples of how it can be used for herbicide application, heat risk, and fall freeze guidance.
Search Before You Spray
If crabgrass in your backyard makes you crabby, you may prefer spraying a pre-emergent in the spring. Many of these products suggest waiting until soil temperatures reach 55°F, on average, since this corresponds to the conditions in which crabgrass begins to germinate.
To check on when this typically occurs, you can choose these options under Step 1 in Climate Thresholds:
- Parameter: Soil Temperature
- Statistic: Mean (Daily Mid-Range)
- Criteria: Greater Than or Equal To
- Threshold: 55°F
Click the Search button, then choose the closest ECONet station to your location on the map and click the View Results button. (For this request, only ECONet stations measure soil temperature, at a depth of 10 cm.)
At the NC A&T SU Research Farm weather station in Greensboro, the average first day with soil temperatures of at least 55°F is on February 14. Of course, this can vary from year to year, but if you want to stay ahead of the weeds, you may want to give your lawn a little love on Valentine’s Day in years to come.
Dog Day Danger
Some may say “it’s not the heat, but the humidity”. During North Carolina summers, though, the combination of both can create potentially dangerous conditions for outdoor activities.
If you’re looking to avoid sustained exposure during the most sweltering days of the year, you can use Climate Thresholds to identify when they typically occur. Start by entering these options:
- Parameter: Heat Index
- Statistic: High (Daily Maximum)
- Criteria: Greater Than
- Threshold: 100°F
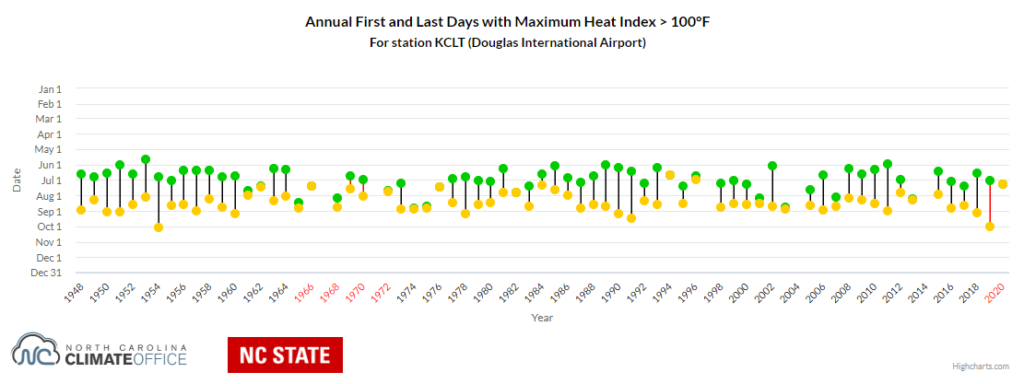
Selecting the Charlotte-Douglas Airport from the map, the statistics show an average of 10.8 days per year with a heat index of more than 100°F, and they typically fall between May 30 (the average first day) and August 17 (the average last day). When checking the Annual First and Last Days chart, note that last year, heat index values made it that high as late as October 2!
In this new version of the Climate Thresholds tool, it is easy to choose a different station by clicking the “Step 2” banner to return to the map. If we now select the New Hanover County Airport in Wilmington, we can see the extreme heat season is longer there — averaging 24.6 days per year — and also shifted later in the year: typically from June 10 to September 1, corresponding to the delay in sea surface temperatures reaching their warmest levels.
Scrolling down to the Data Tables section and clicking “Show Table” next to Streaks, we can see the longest periods of consecutive days meeting the threshold. In Wilmington, heat index values topped 100°F on 18 straight days in July and August 1979, and for 11 days in mid-July last year. Dog days indeed!
First Freeze Facts
Whether you’re harvesting crops or just getting your sprinklers disconnected before they ice up, anticipating the first fall freeze event can be critical for avoiding costly damage. As with any weather phenomenon, the exact timing varies from year to year, but the Climate Thresholds tool can show you, on average, when this first freeze typically occurs.
Up to this point, our searches have all aggregated results by calendar year — that is, shown the average first day on or after January 1 and the average last day on or before December 31. However, using that logic for a freeze request wouldn’t make much sense because our calendar begins amid the winter, when temperatures are routinely below freezing.
For requests like this looking at the occurrence of temperatures below a given threshold, the tool defaults to a Year Type of “Aggregate by Snow Year”. This shifts the calendar to begin in August and end in July, centering each year on the winter season.
And because some stations have more than 100 years of data available, we may also want to restrict our search to only the latest 30-year period to best represent the recent climate of the state.
With that in mind, here’s what you might select to look at first fall freeze days:
- Parameter: Temperature
- Statistic: Low (Daily Minimum)
- Criteria: Less Than or Equal To
- Threshold: 32°F
- Time Period: Specific Date Range, from Aug 1, 1990, to Jun 30, 2020
- Year Type: Aggregate by Snow Year
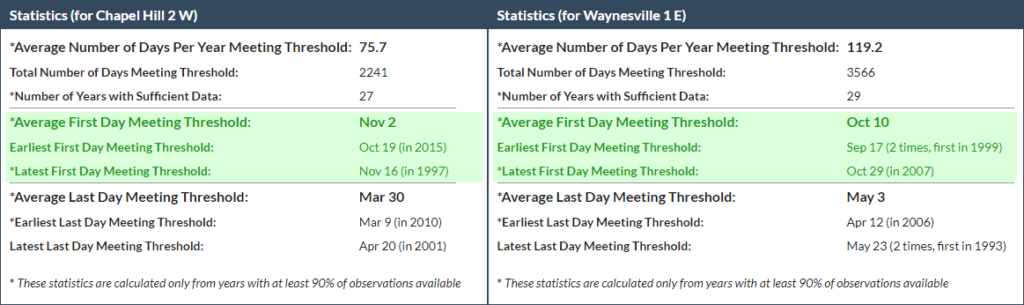
In Chapel Hill at the National Weather Service Cooperative Observer station, the average first date with temperatures at or below freezing is November 2, with a range between October 19 and November 16 over the past three decades. Farther west in Waynesville, the average first freeze date is more than three weeks earlier, on October 10.
Climate Thresholds can also add context to those climatological nuggets bouncing through your brain.
Using this tool, you can find that Hamlet had its earliest recorded 90°F day on March 28 this year. Or the sub-freezing temperatures on May 11 in Yadkinville were tied for the third-latest spring freeze on record there. And in Louisburg, where it rained 4.05 inches on June 17, that was one of just 10 times in 103 years with at least 4 inches of rain in a single day.
These examples are just scratching the surface of what’s possible using the Climate Thresholds tool. Additional parameters are available including relative humidity, dew point, and soil moisture, and you can limit searches to specific seasons or months.
We hope you’ll take some time to explore the tool, learn a bit more about your local climate, and share those results — especially if you find any intriguing charts or facts — on Twitter by tagging us @NCSCO.