Summer Projects: Piecing Together a Weather Data Puzzle
This post is part of a series highlighting the summer projects from our office’s student research assistants. The author, Kelley DePolt, is a rising sophomore in the Meteorology program at North Carolina State University.
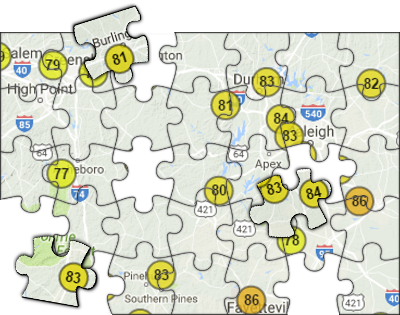
Imagine that the world is a giant puzzle made up of over 100,000 pieces. To add a level of complexity to this, the pieces can change their characteristics at any point in time, often without warning. Sounds frustrating, right?
In the context of weather data, each “piece” is an individual weather station. These stations may be located at large airports (Automated Surface Observing Stations, or ASOS), smaller airports (Automated Weather Observing Stations, or AWOS) or could even be near your neighborhood, such as the National Weather Service’s Cooperative Observer Program (COOP). Together, all of these types of stations create a picture of current and past weather conditions across the entire country.
My summer project at the State Climate Office was to help assemble this immense puzzle by hand. As new weather stations are added across the country, they represent new pieces of the puzzle for us to track.
However, it’s like going from a 500-piece to a 1000-piece puzzle. As we have more and more stations to track, it can become tougher to fit them all together, especially when they change names, add or replace sensors, or are sometimes relocated completely. These complexities can be important for anyone who uses this weather data, so we need to stay aware of these changes and keep our database up to date.
Fortunately, we’re not putting this puzzle together alone. NOAA’s National Centers for Environmental Information (NCEI) maintains the Historical Observing Metadata Repository, or HOMR dataset, which tracks the history of individual weather stations and can be used in research, reporting, and web products like those found on the State Climate Office’s website. The information spanning the lifetime of each station includes things such as identifiers, names, locations, observation times, reporting methods, photos, and equipment replacement history. Since it gives such a complete record of each station, HOMR is like the picture of the finished jigsaw puzzle on the box. It tells us where the pieces fit and what they look like so we can make sure our own database is accurate.
Our goal is to improve the process of updating and adding stations to our database by comparing HOMR with CRONOS. The comparison script I wrote this summer looks at three categories of weather stations: stations that are the same in both databases, stations that have conflicting data between databases, and new stations listed in HOMR that are not found in CRONOS.
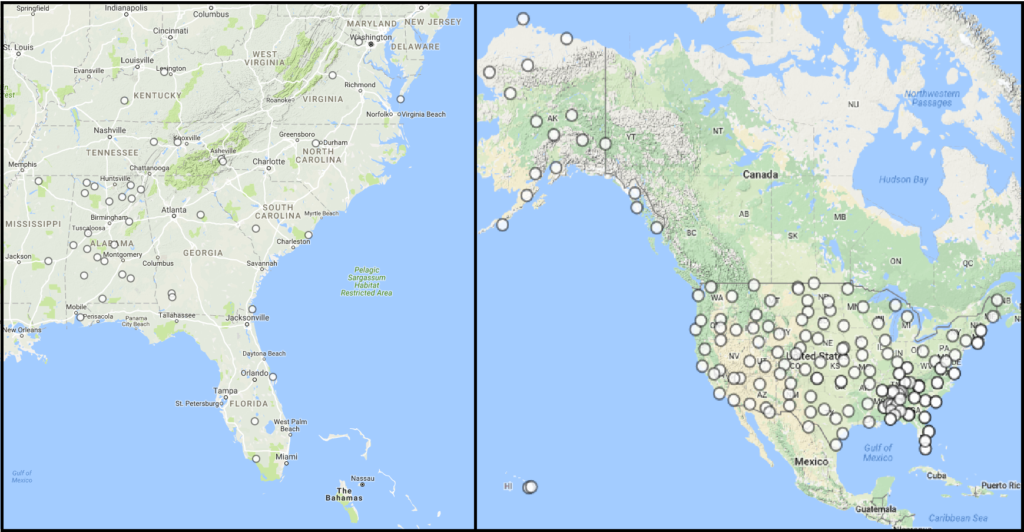
The initial results showed us that a number of stations in our CRONOS Database needed slight updates to match HOMR. Discrepancies occurred mostly in the rounding of latitude and longitude values and in abbreviations within station names. As new stations are found in HOMR, they are being added to CRONOS to provide useful data where it’s not currently available in our database and web products. The US Climate Reference Network (USCRN) managed by NOAA’s National Centers for Environmental Information, had the most new stations which expanded our metadata beyond the bounds of the Southeast.
This script is scheduled to run on a monthly basis to make sure that our information is as up-to-date and accurate as possible. That will make our understanding of weather conditions and the stations that report them a bit less puzzling.
- Categories:


