This post is part of a series highlighting the summer projects from our office’s undergraduate research assistants. The author, Emma Scott, is a sophomore in Meteorology at NC State University.
Have you ever worried about the rising cost of groceries, a parched lawn, or the impending threat of water usage restrictions? Earlier this week we talked about an index that can be used to monitor drought; today we’ll showcase a new website that will help users understand historical drought conditions in their area. This updated page will provide users with detailed explanations about different types of drought and their impacts as well as access to historical drought index data.
Users interested in viewing historical drought index data will have several different indices to choose from. These indices are measures of drought duration and severity. The Standardized Precipitation Index (SPI) relates observed precipitation to historically expected precipitation, and is measured in terms of standard deviations. This index is calculated on many timescales, which makes it possible to monitor different types of drought with different durations.
The suite of Palmer Indices (which include the PDSI, PHDI, modified PDSI, and Z-Index) will also be available. The Palmer Indices are based on an idealized climatological balance that attempts to take into account precipitation, temperature, and subsurface water supply to determine the current drought severity for a variety of sectors.
In-depth explanations of these and more indices will be available as part of the new drought information. It’s important to remember that drought indices provide a way to quantify drought, but the true severity depends on the impacts experienced within meteorological, agricultural, hydrological, and socio-economic fields.
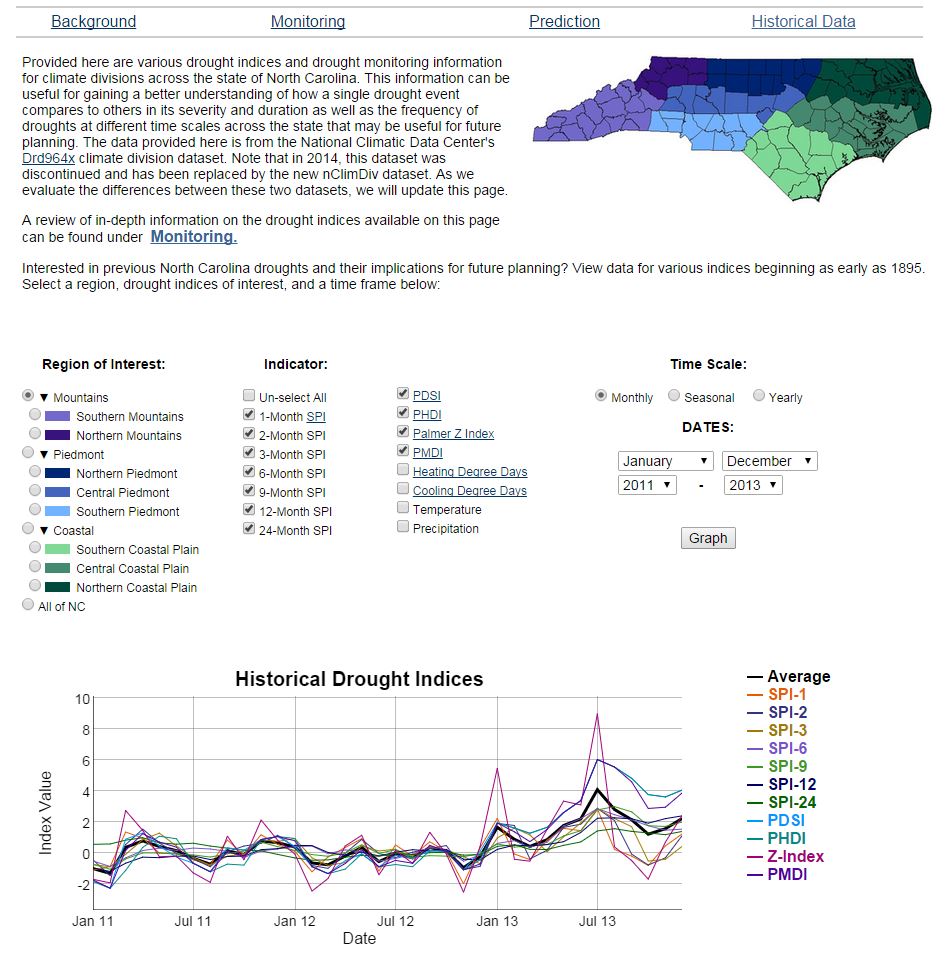
Website users will be able to access climate division drought index, temperature, and precipitation data over a historical period of their choice with an archive that goes back to 1895. This project has specifically involved adding the capability to graph this data dynamically. This will provide users with a quick look at the long-term cycles in the drought indices, as well as an idea of average precipitation and temperature.
Other resources will also be available as part of the webpage such as the North Carolina map from the US Drought Monitor, which classifies the severity of drought being experienced across the nation. This provides a quick look at where in the state drought is occurring and the severity of the drought. Seasonal and monthly drought outlooks for the United States can also be found in the prediction section. These maps show which parts of the country are expected to experience worsening drought or the deterioration of drought conditions, and are based on the current US Drought Monitor, short-term forecasts, and long-term predictions for precipitation, temperature, and soil moisture.