How Hot Does it Feel Outside? Heat Index Explained
Summer temperatures have been ramping up lately, but temperature only tells part of the story about how hot it feels. In this post, we review the history of the heat index, give a climatology for North Carolina, explain how excessive heat events are forecasted, and discuss health hazards posed by high heat.
History of the Heat Index
Before the term currently known as heat index was developed, researchers investigated the effects of both temperature and moisture on the sensation of heat. One of the first studies was done in 1978 by Robert G. Steadman, who was studying the the effects of clothing on heat (or “sultriness”) felt by humans. Building on that work, broadcast meteorologist George Winterling developed a concept known as “humiture”, which explained the apparent heat to his viewers in sultry Jacksonville, FL.
Much like the wind chill calculation, which we described in a previous blog post, Winterling’s humiture equation made various assumptions about the human body, such as the weight, clothing worn, physical exertion, radiation exposure, and even blood thickness. Of course, each person is different and has a distinctive reaction to temperature and humidity, but this early work gave a good estimate of the average person’s perception of “how hot it feels”. Thus, his work was adopted by the National Weather Service (NWS) in 1979, then becoming known as the heat index.
The Current Formula
Since 1979, the heat index formula has undergone several revisions. Today, there are two equations primarily used for its calculation: the short version and the long version. The long version is generally considered more accurate — sometimes cited as being accurate to within 1.3°F — but it’s important to note a few things about these calculations:
| Short Version | Long Version |
|---|---|
| HI = -42.38 + 2.049 x T + 10.14 x RH – 0.2248 x T x RH – 0.006838 x T2 – .05482 RH2 + 0.001229 x T2 x RH + 0.0008528 x T x RH2 – 0.00000199 x T2 x RH2 | HI = 16.923 + ((1.85212 x 10⁻¹) x T) + (5.37941 x RH) – ((1.00254 x 10⁻¹) x T x RH) + ((9.41695 x 10⁻³) x T2) + ((7.28898 x 10⁻³) x RH2) + ((3.45372 x 10⁻⁴) x T2 x RH) – ((8.14971 x 10⁻⁴) x T x RH2) + ((1.02102 x 10⁻⁵) x T2 x RH2) – ((3.8646 x 10⁻⁵) x T3) + ((2.91583 x 10⁻⁵) x RH3) + ((1.42721 x 10⁻⁶) x T3 x RH) + ((1.97483 x 10⁻⁷) x T x RH3) – ((2.18429 x 10⁻⁸) x T3 x RH2) + ((8.43296 x 10⁻¹⁰) x T2 x RH3) – ((4.81975 x 10⁻¹¹) x T3 x RH3) |
- They are based on regression analyses using general assumptions about the human response to heat, so what feels like 100°F to your friend might feel like 105°F to you, depending on your physiology, clothing, and other factors.
- The sensors that measure temperature and relative humidity have their own limitations. For example, the resistive temperature devices at most standard weather stations have a margin of error of 1 to 2 degrees. Those potential inaccuracies don’t disappear when they are used in the heat index equations, so it’s good practice to consider the sensor accuracy when reviewing any weather data.
In other words, the long version may give a “more correct” value, but both equations can give a reasonable (but not 100% accurate) estimate of the apparent heat.
A Climatology of Heat Index
Several years ago, SCO staff developed a Heat Index Climatology for weather stations in North Carolina and surrounding states using historical measurements of hourly temperature and relative humidity. The calculations use the long version of the heat index equation, and focus on the number of days throughout the station’s history on which the maximum heat index met various thresholds. The following table depicts the annual average heat index counts for locations across the state from 1972-2013.
| Location | Avg. Hourly Counts (100 to 104°F) | Avg. Hourly Counts (105 to 109°F) | Avg. Hourly Counts (110 to 114°F) | Avg. Hourly Counts (115°F and above) | Total |
|---|---|---|---|---|---|
| Asheville | 1 | 0 | 0 | 0 | 1 |
| Charlotte | 35 | 4 | 0 | 0 | 39 |
| Cherry Point | 58 | 24 | 7 | 1 | 90 |
| Greensboro | 23 | 2 | 0 | 0 | 25 |
| Hatteras | 24 | 3 | 0 | 0 | 27 |
| Jacksonville | 66 | 29 | 7 | 2 | 103 |
| Raleigh | 56 | 13 | 2 | 0 | 71 |
| Wilmington | 73 | 30 | 6 | 1 | 109 |
Excessive Heat Forecasts
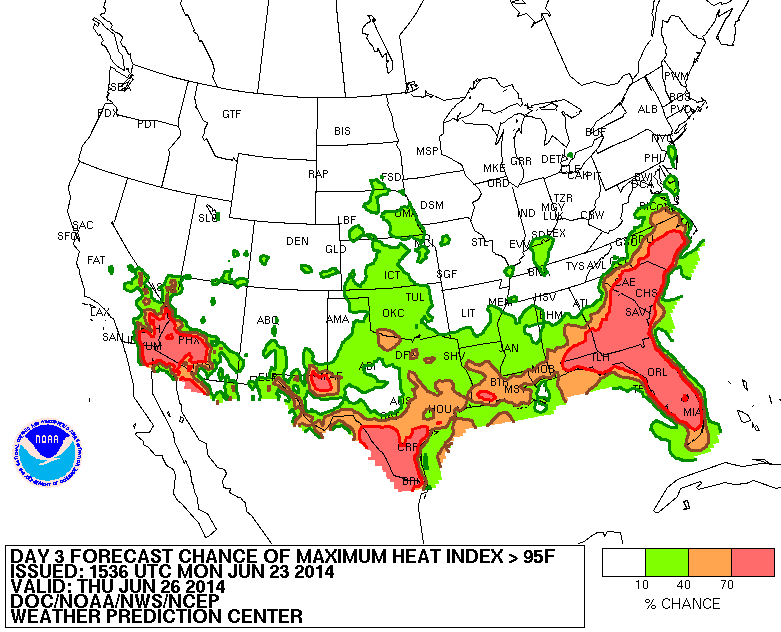
Heat events are quite common in this part of the country, but how do forecasters know whether a heat event will be “excessive” or not? The answer: They consider the heat index! Forecasters use temperature and relative humidity output from weather models to determine heat index values for a given area over the next few days. Additional guidance products compiled by the NWS Weather Prediction Center feature 3 to 7 day probability forecasts of heat index.
If the potential exists for an excessive heat event during the next 3 to 7 days, your local NWS office may issue an Excessive Heat Outlook. Excessive Heat Watches are issued if the conditions are favorable in the next 24 to 72 hours. Excessive Heat Warnings are put out when a heat event is already taking place, forthcoming, or has a very high probability of occurring in the next 36 hours. Such alerts are issued when the heat index is expected to equal or exceed 105°F-110°F, when life-threatening conditions are likely.
Heat Effects on Health
So why is understanding heat index important?
Our bodies can’t cool themselves as effectively during extremely hot and humid weather. Heat-related illnesses, ranging from heat cramps and heat exhaustion to heat stroke, can occur as a result. Several factors can put a person at greater risk for heat illnesses, including their age, chronic diseases or mental illnesses they may have, prescription drugs they may be taking, or prior exposure to the sun (as sunburns can prevent the skin from shedding excess heat). As we move into the hottest part of the summer, remember the following tips to avoid heat-related illnesses:
- Stay in indoor, air-conditioned locations as much as possible
- Drink plenty of fluids
- Wear lightweight, light-colored clothing
So before you head outdoors, keep a close watch on the heat index — region-wide values are available for viewing via our Weather Map tool.
- Categories:


