This post is part of a series highlighting the summer projects from our office’s undergraduate research assistants.The final part of this series is by James McClellan, a recent graduate of NC State with a degree in Meteorology and a minor in Biological Sciences.
My work at the State Climate Office has been focused on developing an interpolation method that provides detailed estimates of temperature and precipitation across North Carolina. Interpolation is a process of estimating data values between known values. The purpose is to provide a statewide snapshot of conditions during a selected time period, such as precipitation during June 2013.
I have been working with different types of selection periods: single month, series of months, single day, and series of days. These estimates are created by overlaying a calculated departure from a 30 year average, or normal, at NWS COOP stations onto a gridded 800-meter resolution PRISM 1981-2010 normal base period.
I have created historical gridded monthly estimates from January 1970 up to the most recent complete month of this year. I have developed a webpage that allows users to easily visualize this data and anticipate a public launch of the site in the near future. For each month, you can also view a calculated departure from normal and percent of normal in addition to the estimated variable for that month (temperature or precipitation).
You may remember all the rain we had this past summer throughout much of NC, but which locations got exceptionally drenched this past June? Using the web tool, this is easy to determine!
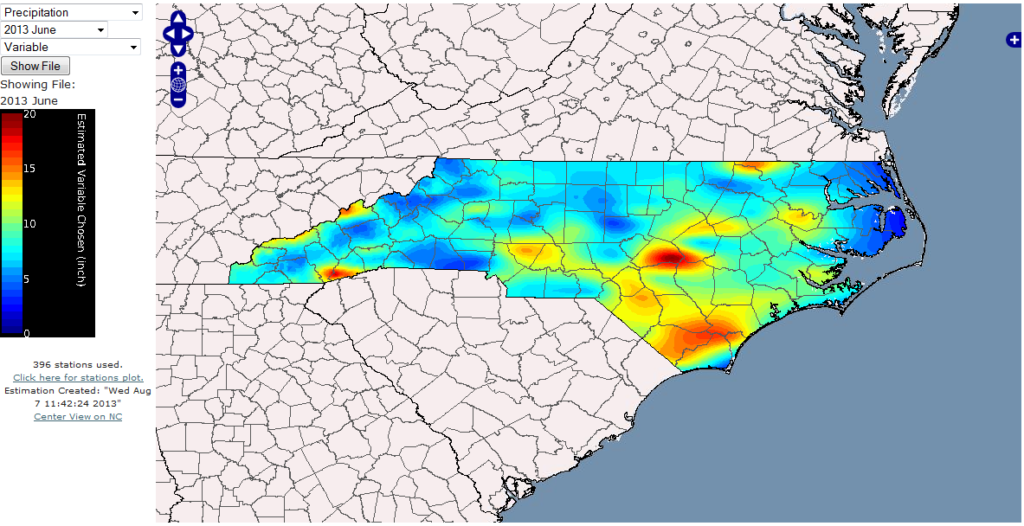
It is interesting to note that, although there were many places with high precipitation amounts, there were also some places with very little! It is often even more useful to see how much a month differs from its climatological normal. This next image shows the departure from normal for June 2013. Some of the state received more than 4 times the normal June precipitation!
Monthly estimates are great for seeing the big picture, but what about the smaller more extreme events that can often be smoothed over when averaging temperature data over an entire month or series of months? This past summer I have been expanding on my previous monthly estimate work by developing daily normal grids and daily maximum and minimum temperature estimates also at the 800m resolution.
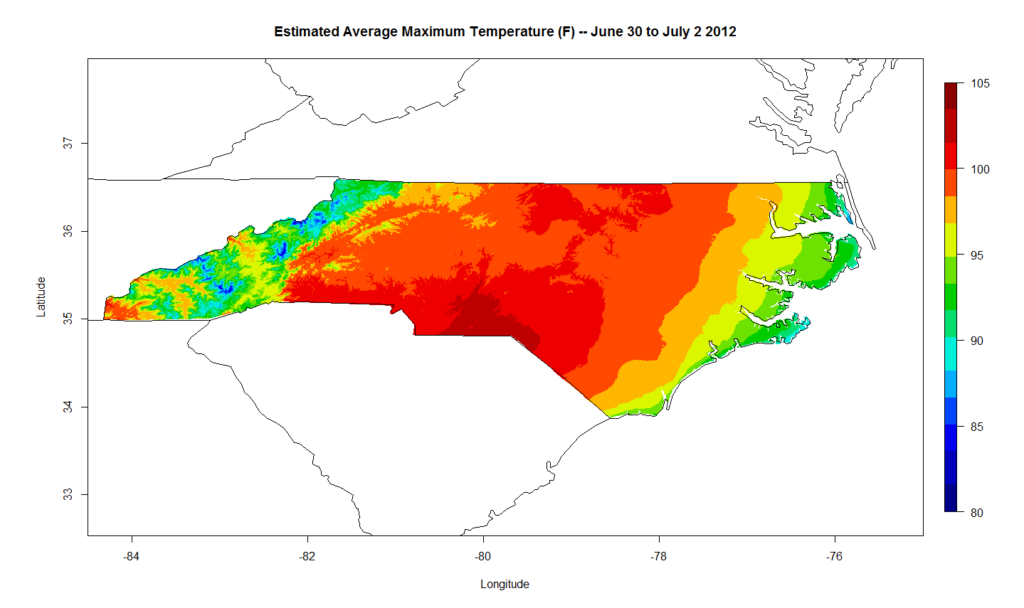
Let’s take a look at the 2012 heat wave that swept through North Carolina. Using the daily estimate method, one can select a day or series of days for which they would like to know the estimated high temperature. The image below shows the estimated average maximum temperature over the three-day period from June 30 to July 2, 2012, an exceptionally hot portion of the heat wave. You can see that temperatures were quite hot statewide, many close to or exceeding 100 degrees Fahrenheit.
These are estimates, and as such they will fall prey to the inaccuracies and shortcomings that is to be expected of estimates. Examples include the nature of the interpolation technique, the number and proximity of stations to each other, and the degree of variability of neighboring stations. However, further testing is being conducted to determine how well these daily estimates represent actual station data, but so far the results look promising. That being said, these estimates could be used in a variety of ways – to quickly glance at past weather events, as a substitute when station data is unavailable at a location, or perhaps as a gridded ingest for models.
Sources:
- 800m PRISM normals from PRISM Climate Group
- NWS COOP from National Weather Service