Cloudy Weather But Little Rain in October
Monthly statistics for October 2013:
Statewide Average Precipitation: 2.34 inches (51st driest since 1895)
Statewide Average Temperature: 60.08°F (22nd coldest since 1895)
* Values generated from preliminary numbers
Cloudy October Tempers our Temperatures
You may have noticed October seemed a bit on the cloudy side in your area, especially toward the beginning of the month. This begs the question — how does last month compare historically to other Octobers in terms of cloudiness? By analyzing the hourly cloud cover observations from stations across the state, we were able to put last month’s values into a historical perspective. The table below depicts the percentage and ranking of cloudy observations over the last 16 years (i.e. those that reported “broken” or “overcast” skies for a given hourly report).
| Location | Percentage of Cloudy Observations in October 2013 | Historical Cloudiness Ranking for October 2013 |
|---|---|---|
| Asheville | 38.2% | 6th |
| Cape Hatteras | 42.8% | 2nd |
| Charlotte | 57.3% | 4th |
| Elizabeth City | 44.3% | 3rd |
| Fayetteville | 46% | 3rd |
| Greensboro | 62% | 2nd |
| Raleigh | 64.5% | 3rd |
| Wilmington | 46.8% | 2nd |
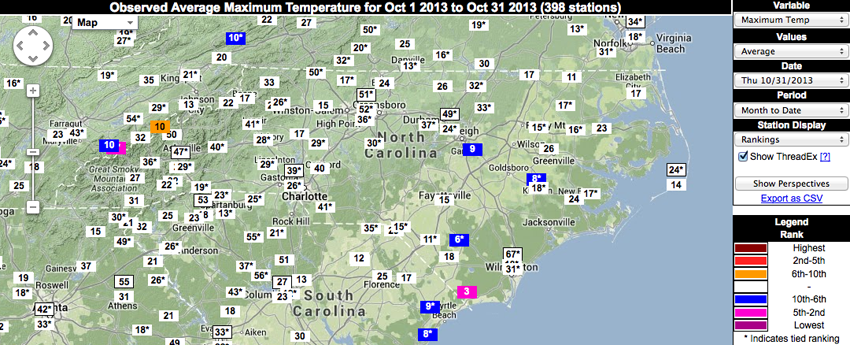
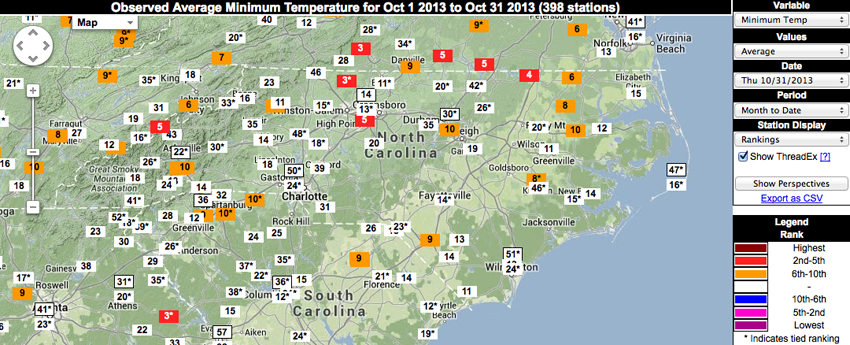
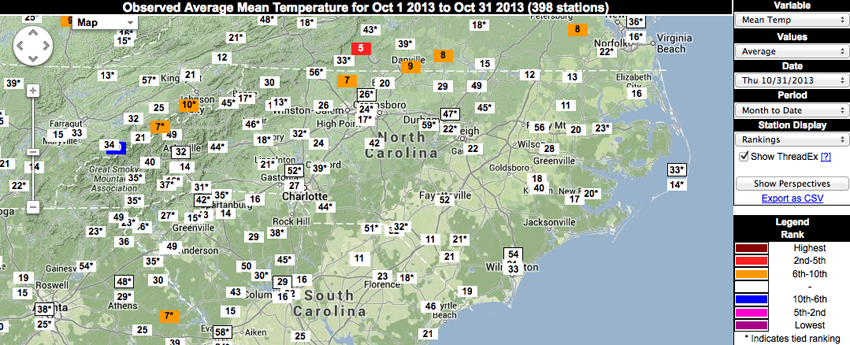
The cloud cover in October acted like a reflective blanket for our atmosphere, keeping our daytime high temperatures a bit on the cool side, and our nighttime low temperatures a bit on the warm side. Several cities reported minimum temperatures in the top 10 warmest on record. However, mean temperatures were fairly close to normal for most of North Carolina, with generally warmer conditions in the northern and northeastern parts of the state.
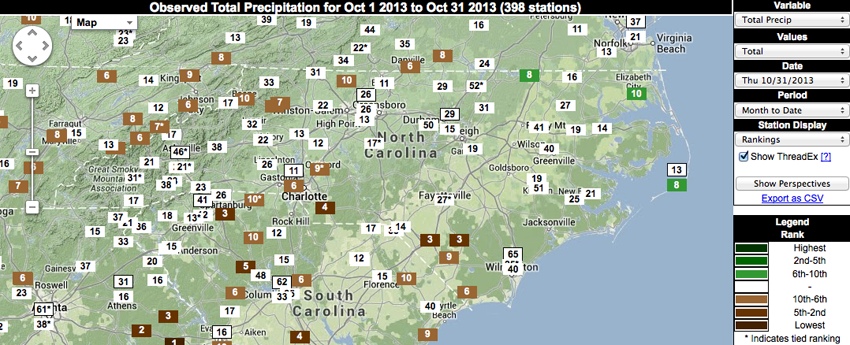
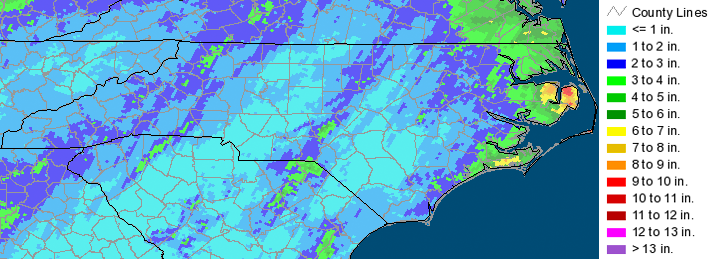
Wet in the East, Dry Everywhere Else
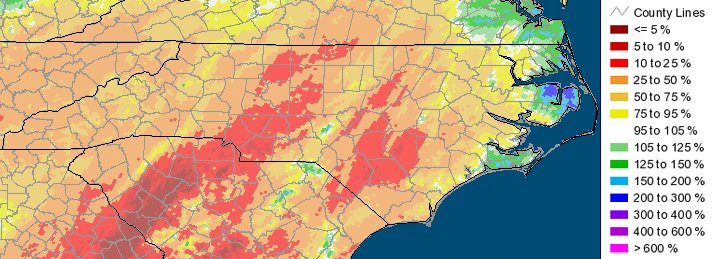
In October, rainfall amounts were ample near the coast but not in other locations across the state. Coastal communities received most of their rain from a single, slow-moving system on October 7-10 that produced more than 4 inches across the Inner and Outer Banks. The rest of the state had dry conditions, with most communities receiving less than half of their normal rainfall.
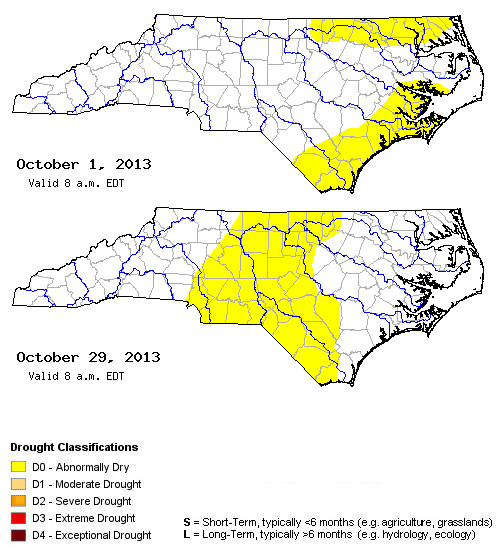
The result is a shift in the depiction of dry conditions in the US Drought Monitor. Coastal communities that were previously an area of focus got relief, while counties further west moved into Abnormally Dry status by the end of October. Streams in the central part of the state have dropped into dry levels, while streams in western NC continue to benefit from the exceptionally wet spring and summer of 2013. Indeed, many western communities will see 2013 go down as one of the wettest on record, despite the drier conditions over the past couple of months.
With all these dry conditions, why no official drought? Impacts of the dryness are hard to find. For agricultural communities, the dry fall has made harvest of soybeans and cotton much easier. Most other communities have low demand for water during this time of the year, and so there are few, if any, impacts from the lack of rainfall. And without impacts, there is no drought — just dry weather.
- Categories:


