Summer Projects: PINEMAP Web Tools
This post is part of a series highlighting the summer projects from our office’s undergraduate research assistants. The fifth part of this series is by Andrew Martin, a junior majoring in Meteorology and minoring in Computer Science at NC State.
One of my responsibilities over the summer was to develop web tools that would benefit the PINEMAP project. PINEMAP was developed to increase the efficiency of large pine tree plantations in the south. These plantations are referred to as “stands”, and professional foresters can use the web tools available on the PINEMAP DSS (decision support system) to increase the stands’ productivity and improve sustainability in various climates.
As a planned addition to the PINEMAP DSS, this web tool will allow foresters to view climate data for each PINEMAP state and climate division. The tool includes various drought indices which enable foresters to view past climate conditions and use this information to plan future harvests.
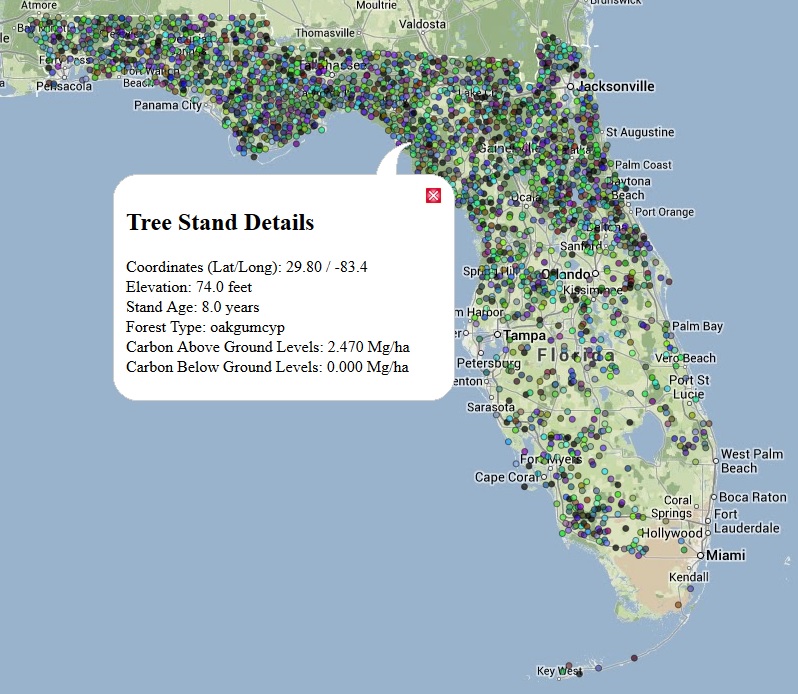
My ongoing fall project includes developing a web tool which can display information about various tree stands in Florida. These forests supply lumber for new home construction and reduce carbon dioxide levels in the atmosphere by storing it in their trunks, branches, and other parts of the tree.
Each point on the map displays information about the stand such as coordinates, age, type of forest, and carbon storage levels. If one of their goals is to maximize carbon sequestration, foresters can use this map of carbon storage levels to find the best locations for planting new stands.
Additionally, as part of my field experience at the SCO, I was able to assist with maintenance of multiple NC ECONet weather stations located across the state and was able to help install a new station at Mt Jefferson. To benefit our partners at the Forest Service, most of these stations have been outfitted with a wind sensor at 6 meters. They use this data to help protect the public from forest fires. Along with wind, also measured is temperature, precipitation, humidity, radiation, and soil temperature.
These data are publicly available and are particularly beneficial to farmers who wish to improve their crop yield. Improved crop yields can not only keep costs affordable, they can also lead to improved quality of the produce at your local market!
- Categories:


