May brought a wetter weather pattern and prevailing above-normal temperatures in North Carolina. With summer now upon us, we also look at outlooks for the Atlantic hurricane season.
Rain Returns and Drought Dwindles
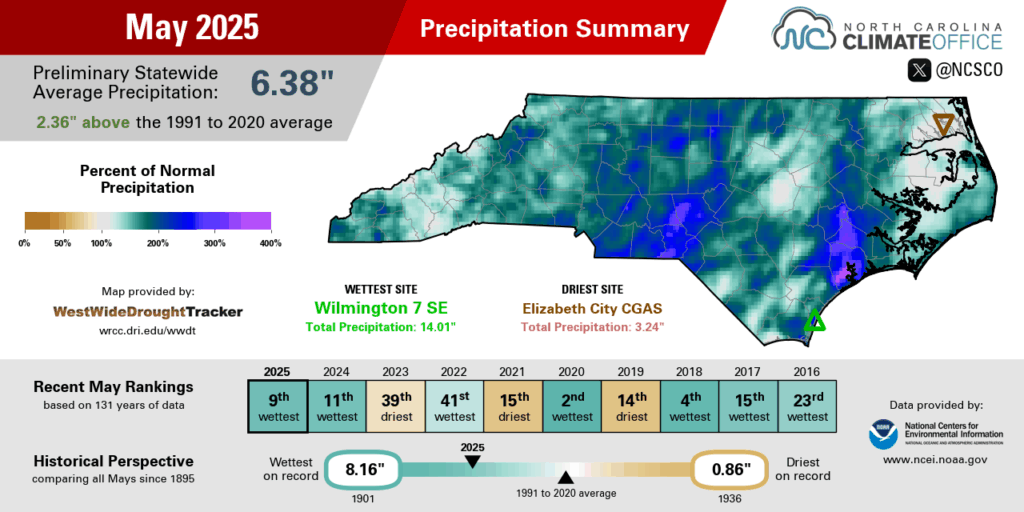
With multiple rounds of significant rain across the state, May reversed our recent dry trend and brought drought relief in many areas. For the month as a whole, the National Centers for Environmental Information (NCEI) notes a preliminary statewide average precipitation of 6.38 inches and our 9th-wettest May since 1895.
May broke a string of seven consecutive drier-than-normal months dating back to October, which spanned our entire winter season along with March and April. Our last longer streak was ten dry months in a row between December 2006 and September 2007, when the exceptional 2007 drought developed.
Rain was almost an everyday occurrence somewhere in the state last month thanks to a combination of frequent moisture-rich weather systems passing through and localized showers and storms popping up.
Among our wetter days, some Piedmont sites picked up more than 2 inches on May 4 and May 9 as a pair of low pressure systems moved in, more than 4 inches fell at Boone and Grandfather Mountain on May 12 along a warm front, and parts of the southern Coastal Plain had up to 2.5 inches on May 30 from an approaching cold front.
We hadn’t seen rain in these amounts in quite some time. The 2.78 inches on May 8 in Asheville and 2.26 inches on May 9 in Shelby were the wettest days at both sites since Hurricane Helene moved through last September.
Farther east, the 3.01 inches at Hatteras on May 28 made for its wettest single day since September 13 of last year, when Potential Tropical Cyclone Eight crept up on our coastline. And New Bern had 2.76 inches on May 12, which was its wettest day since August 8 during Tropical Storm Debby.
Some of our thunderstorms even became severe, with seven confirmed tornadoes across the state. Three of those occurred in Edgecombe County within a 12-hour period on May 12 and 13.
That active weather pattern made it one of the top ten wettest Mays on record across much of the state. Among long-term weather observing stations, it was the 10th-wettest May for Hickory, the 6th-wettest May in Greensboro, and the 3rd-wettest May in New Bern since 1949.
The few drier-than-normal areas last month were along the Albemarle Sound, including in Elizabeth City, which was 0.44 inches below normal in its 39th-driest May out of the past 90 years.
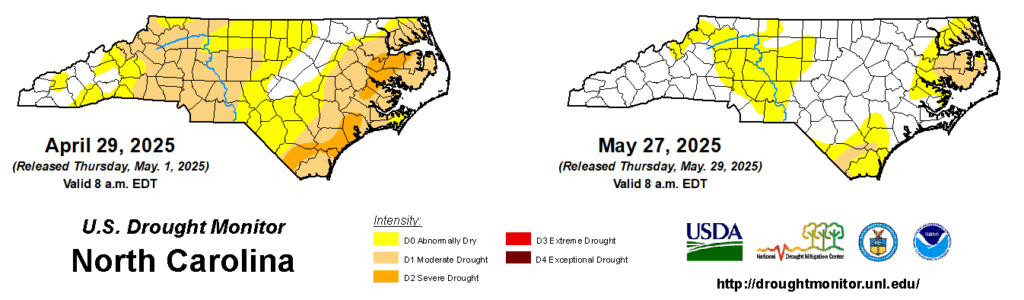
That rain made a big difference in our drought, which had been going on for more than six months in some areas. Pockets of Severe Drought (D2) in eastern North Carolina improved to Moderate Drought (D1), and the drought across the western Piedmont and northern Mountains reduced to just an Abnormally Dry (D0) designation, reflecting longer-term rainfall deficits since the beginning of the year.
Farmers have also benefitted from the rain, with near- to above-normal soil moisture levels statewide, crops mostly in good or excellent condition, and planting progress for peanuts, soybeans, and tobacco running ahead of the five-year average, per the latest USDA/NASS Crop Progress & Condition Report.
Staying Warm with Summer Approaching
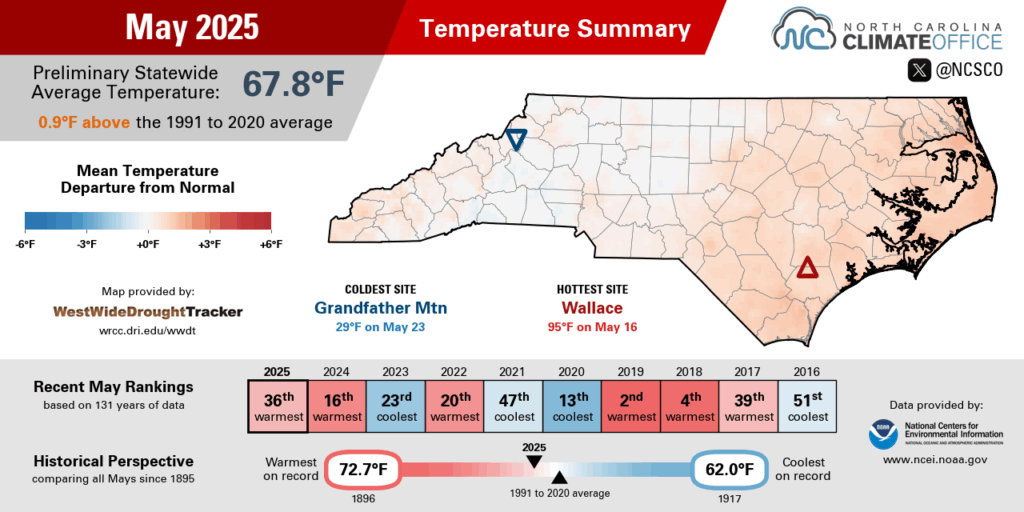
May brought mostly above-normal temperatures, but not as much of the summer sizzle as we saw one year ago. Still, it ranked as our 36th-warmest May on record out of the past 131 years with a preliminary statewide average temperature of 67.8°F, per NCEI.
It was an especially warm month in some coastal areas that had mean temperatures 3 to 5 degrees above normal. That included the 10th-warmest May on record in New Bern, tied for the 8th-warmest May in Hatteras, and the 2nd-warmest May for Ocracoke out of 40 years with observations.
It was also a warm month farther inland, including the 19th-warmest May in Raleigh dating back 139 years, but there were only two days all month there – on May 1 and 2 – with high temperatures of 90°F or greater. That matched the total from April, and was lower than our May totals in recent years, when we had five 90-degree days in 2024 and 2021, six days that hot in 2022, and eight such days in 2019.
Rather than extreme heat, we had plenty of warm nights and persistent above-normal temperatures that made for such an overall warm month. Based on the average minimum temperatures, it was the 7th-warmest May on record in Fayetteville and the 8th-warmest in Greenville. And Wilmington had 23 days with temperatures at or above 80°F, which was tied for the 13th-most in any May out of the past 151 years.
Last month did start on a warm note as high pressure parked off our coastline elevated temperatures into the upper 80s on May 1 and 2. A similar pattern with high pressure over the Southeast US returned by mid-month, and temperatures across the Sandhills and Coastal Plain soared into the low 90s, including a high of 93°F in Lumberton on May 16 – its first 90-degree day of the year.
It wasn’t a wall-to-wall warm month, though. On summer’s doorstep during the final week of the month, we had some uncommonly chilly weather on May 27 with clouds and rain in the air and cool high pressure to our north. That day, the high temperature reached only 57 degrees in Greensboro, setting a new daily record low maximum there.
As we prepare for the more typical hot weather expected at this time of year, we’re pleased to share a new Heat Action Plan Toolkit, developed by the North Carolina Office of Recovery and Resiliency with input from experts across the state, including at our office. To learn more about how local communities can use this toolkit to make their own heat action plans, join us for a webinar on Friday, June 6 at 12:30 pm.
Hurricane Season Outlook
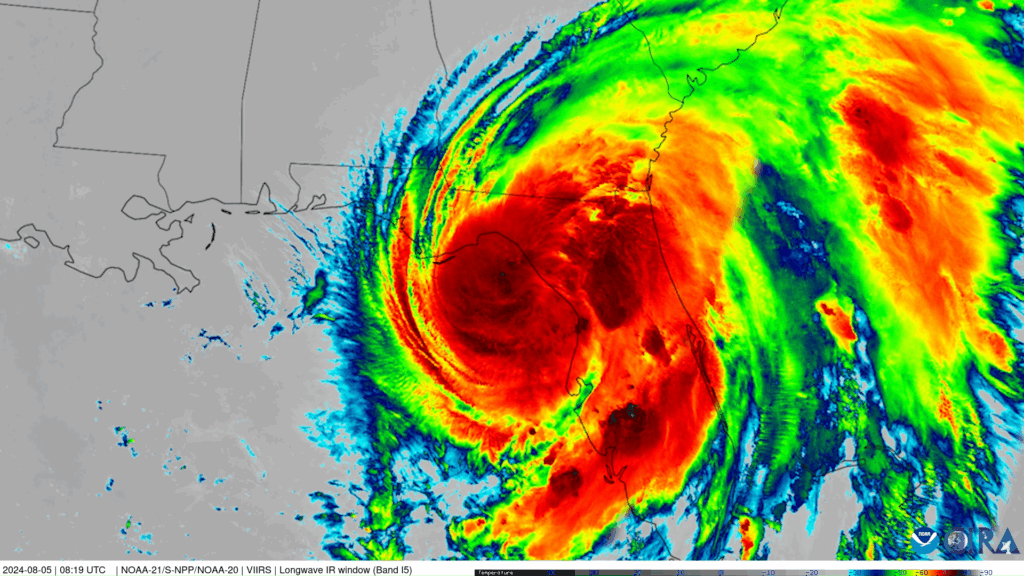
Following an active summer and fall in 2024 that saw flooding rains from Tropical Storm Debby, a coastal deluge from the non-tropical September storm, and our state’s costliest and deadliest storm on record in Hurricane Helene, there’s an understandable anxiety entering this hurricane season about whether more storms are on the way.
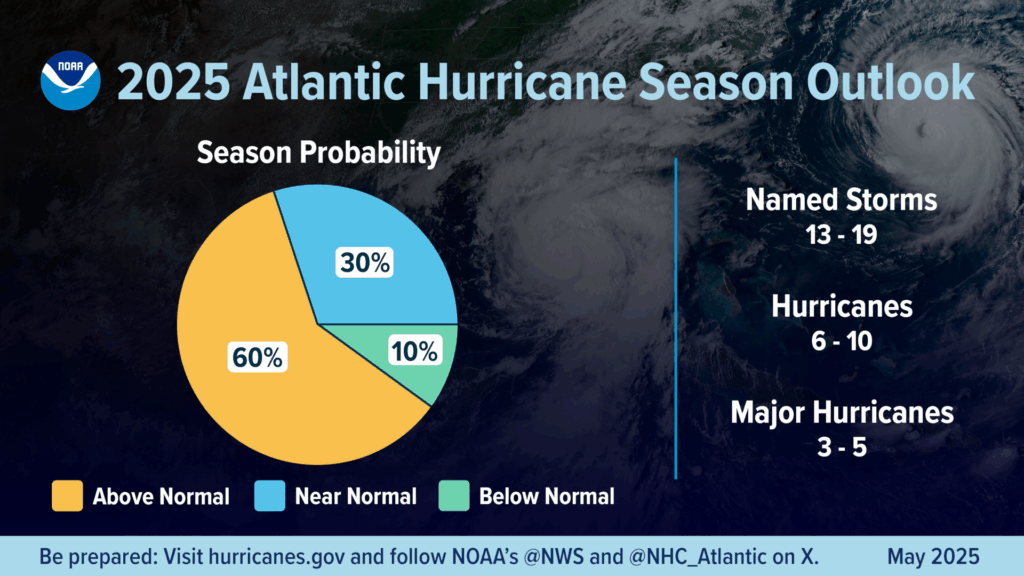
NOAA’s preseason outlook gives a 60% chance of above-normal tropical activity in the Atlantic this year, calling for 13 to 19 named storms and 6 to 10 hurricanes. Those ranges would be in line with last year, which had 18 named storms and 8 hurricanes.
Other forecast teams are also predicting near- to above-normal activity, with Colorado State’s forecast showing 17 named storms and 9 hurricanes, while NC State’s forecast is on the lower end with 12 to 15 named storms and 6 to 8 hurricanes.
Several environmental factors are set to shape the season and generally favor storm formation:
- Sea surface temperatures across the north Atlantic continue to be warmer than normal. While the main development region didn’t match the record temperatures from 2023 and 2024 this spring, the Gulf of Mexico remains near record warm levels, and that’s one of the most common formation regions especially for early-season storms.
- The West African Monsoon – a wind-driven confluence of moisture between June and September – is expected to be active this summer, with more precipitation across the African continent. That moisture could help to charge up waves of disturbed weather before they move over the tropical Atlantic.
- The expected weaker upper-level winds should generally reduce the wind shear that can rip apart developing storms. This feature is in part because of the warmer water, since the warm air above wants to rise, which counteracts the sinking motion of the subtropical high across the Atlantic. A weaker high means less of a gradient from high to low pressure, which weakens the overall wind patterns over the basin.
One factor that’s largely absent from this list is the El Niño/Southern Oscillation, or ENSO. While we often look at ENSO’s likely evolution for clues about how the tropical environment may look later in the hurricane season – as with last year, when a developing La Niña was expected to lead to weaker winds aloft – the current ENSO forecast isn’t too telling.
In a neutral phase at the moment after the wintertime La Niña faded, most forecasts keep those neutral conditions around through at least the fall. Another weak La Niña developing is also a possibility, but it’s much less likely that we’ll see a trade-wind-whipping, hurricane-suppressing El Niño emerge this year.
It’s tough to tell in advance exactly when and where storms may form. But with ingredients for activity such as warm water already in place, especially in the same region where Helene rapidly intensified last fall, it’s smart to be ready well in advance of any potential storms this year.
The National Weather Service recently held its annual Hurricane Preparedness Week, and the Newport/Morehead City office assembled a number of quick tips and resources for preparing for hurricanes and the variety of hazards they can bring to our state.
It’s also worth reviewing FEMA’s flood safety tips and their Flood Map Service Center to determine whether your home and community are in flood-prone areas, which last year’s storms revealed memorably and destructively.