It was a record wet March in parts of North Carolina, while the entire state experienced warm temperatures and the corresponding arrival of pollen season last month.
Frequent Rains Roll Through
Heavy rain especially at the coast fueled a wet March for the state. NCEI reports a preliminary statewide average precipitation of 5.45 inches, which ranks as the 28th-wettest March out of the past 130 years.
A lion-like start saw back-to-back rain events in the first few days of the month. One low pressure system on March 1 and 2 brought two-day totals of more than 2 inches in parts of the southern Mountains and along the coastline, while another system just offshore on March 4 brought up to 4.33 inches at Cape Hatteras.
After just four days, Hatteras had already exceeded its normal March rainfall, but there was plenty more to come throughout the rest of the month.
March 6 saw more widespread rainfall with localized totals of more than 2 inches at the coast, while the Piedmont had more than an inch on March 9.
Later, a low pressure system on March 23 again soaked the coastline, while the entire eastern half of the state was in front of the firehose on March 27 and 28, with up to 2.97 inches in Rockingham.
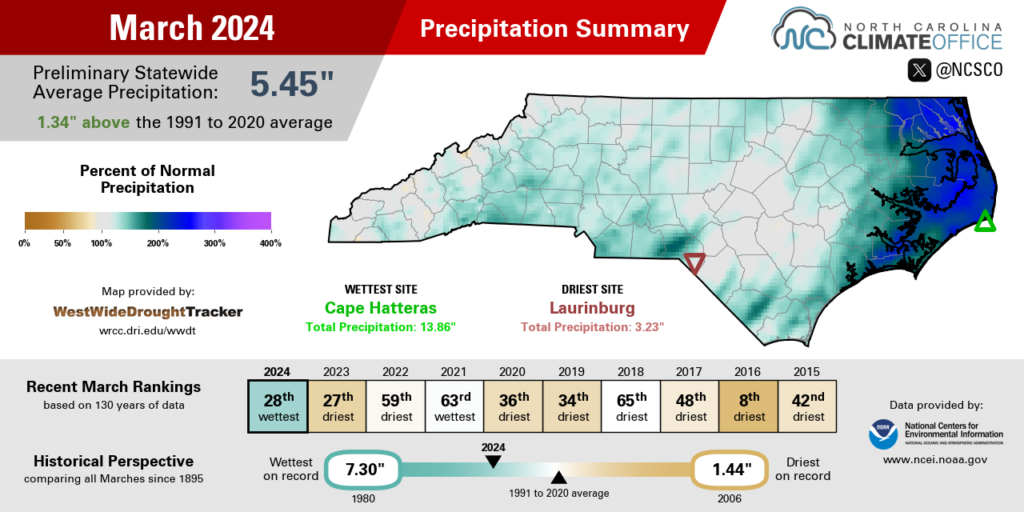
For the month as a whole, Hatteras totalled 13.86 inches – more than three times its normal monthly rainfall – to easily eclipse the 11.20 inches from 1989 and become the wettest March on record there. It was also a record wet month in Elizabeth City, which had 9.25 inches in total.
Thanks to the early-month rainfall, it was also a notably wet month in the Mountains. Tryon had its 12th-wettest March in the past 104 years, and it was the 11th-wettest March for Lake Lure since 1949.
Following a dry February, the wet March was a welcome sight, even if the repeated rainfall and offshore storm systems wreaked havoc on the roads up and down the Outer Banks.
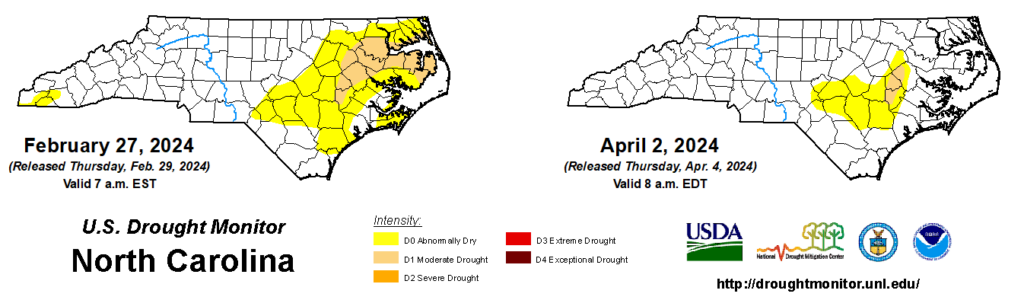
Moderate Drought (D1), which returned to parts of eastern North Carolina at the end of February, has since shrunk to cover only parts of Greene, Lenoir, and Pitt counties. On-the-ground conditions, particularly streamflow levels, saw good recoveries in March, but precipitation deficits of 2 to 3 inches — or about 33% less than normal — remain in parts of the Coastal Plain since the beginning of 2024.
A Spring Sensation in the Air
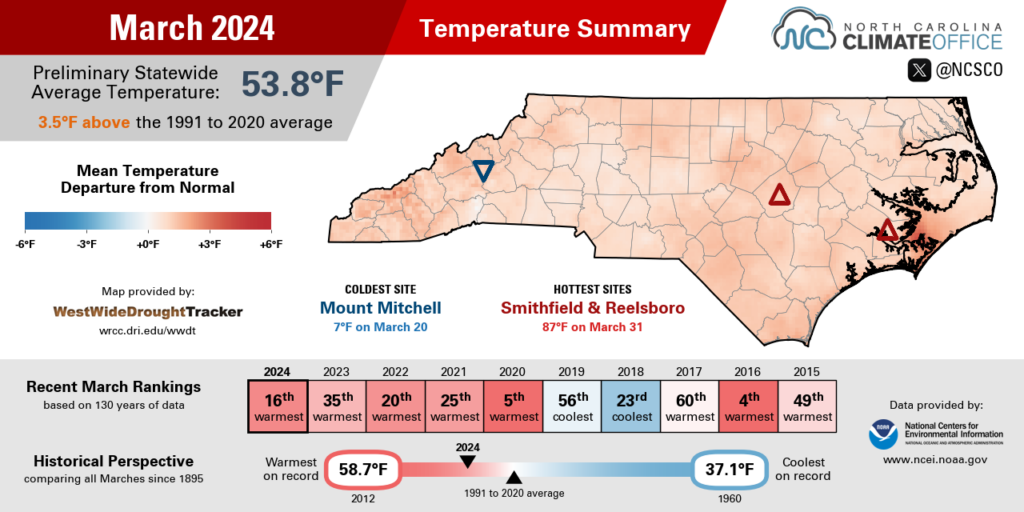
Consistently above-normal temperatures throughout the month made for an overall warm March in North Carolina. The National Centers for Environmental Information (NCEI) notes a preliminary statewide average temperature of 53.8°F and our 16th-warmest March since 1895.
Our average temperatures were 3 to 6 degrees above normal, which left this among the top ten warmest Marches observed in some areas. New Bern and Raleigh each tied for their 9th-warmest March on record, while it was the 9th-warmest in Fayetteville and the 6th-warmest in both Greenville and Hickory.
The warmth started early, as high temperatures hit the low 70s on March 3 with high pressure overhead. A similar pattern on March 12 to 14 helped temperatures warm into the 80s, including a maximum of 82°F in Charlotte – its warmest day of the year to that point, and more than two weeks before than the average first day that warm of April 1.
The most significant cooldown of the month happened from March 24 to 26 as high pressure to the north funneled colder air across the state. On the morning of Monday, March 25, low temperatures dipped into the 20s in parts of central and western North Carolina, which resulted in a light freeze for some vegetation.
And not all areas even felt that brief chill. Raleigh‘s lowest temperature all month was 33°F, while Wilson never dropped below 35°F. At both sites, it was only the second time in the past 100 years that they’ve stayed above freezing all month in March, and it hadn’t happened at either location since 1945.
During the final week of the month, our temperatures were again on the rise, climbing from the 50s on March 27 into the 80s by March 31. Our Sandhills ECONet stations in Hamlet and Lilesville both hit 85°F and set new daily record high temperatures dating back to 2008.
The prevalent warmth during March is perhaps best evidenced by the number of days with temperatures at or above 70°F. There were 15 such days in Raleigh, 17 in Wilmington, and 20 in Lumberton. Farther west, Hickory had 14 days that warm and Lincolnton had 16 days in the 70s or above, which was the 4th-most on record at both sites, and the most in any March since 2016.
The Pollen-pocalypse Arrives
If your allergies have already been active this spring, then you can blame the weather, as it was primed for peak pollen production in March.
It starts with our temperatures, which began warming to spring-like levels back in February and urging vegetation of its winter dormancy. As we noted in our February climate summary, leaf-out began 2 to 3 weeks earlier than normal this year, so that got the pollen season off to a fast start. We saw the first uptick in grass pollen on March 1, while typically, those levels don’t begin increasing until late March or early April.
Rain can be a blessing and a curse when it comes to pollen, and it certainly was a bit of both last month. Showers in the first two weeks of March helped grasses and other vegetation green up and reach maturity more quickly, at which point they sent even more pollen into the air.
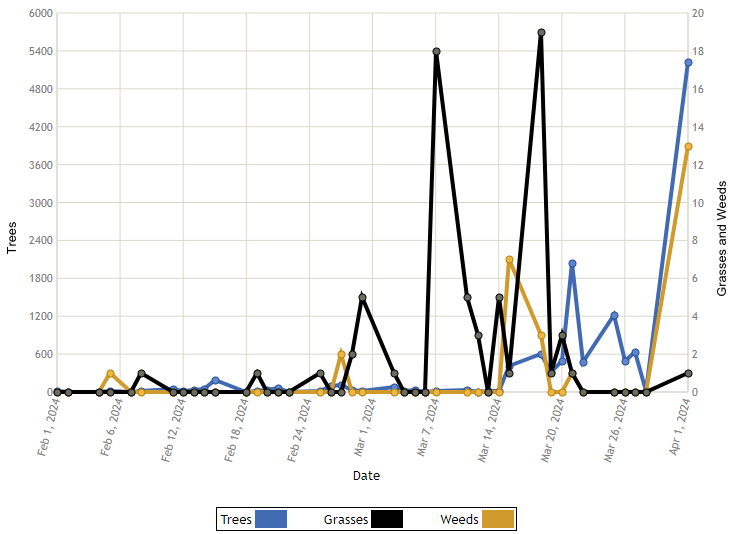
More rain later in the month finally helped wash some of that pollen away, but by that point, the nasal nuisance had been fully unleashed. Grass pollen levels in Raleigh hit 17.9 grains per cubic meter on March 8 and 19.2 grains on March 18, based on the North Carolina Division of Air Quality’s sampling data. Those are the two highest observed March grass pollen values in its online archive dating back to 2006.
Between those rain events, winds were a factor as well. Gusts in excess of 30 mph on March 10, March 20, and March 30 helped get the pollen swirling in the air at regular intervals throughout the month.
That culminated in a spike in tree pollen levels on April 1, with 5,219 grains per cubic meter – the highest ever daily count observed by NC DAQ in Raleigh – primarily from mulberry, pine, oak, sweet gum, and ash trees.
Because of its direct link with temperatures, our spring pollen seasons are feeling the effects of climate change. Research at NC State’s College of Natural Resources notes that the pollen season has expanded by almost a month over the past 30 years, beginning about 20 days earlier and ending about 10 days later.
That extra time allows for more overall pollen production, and when the weather lines up, it can make for more extreme allergy-aggravating days as we’ve seen over the past month. That’s nothing – or, perhaps, something – to sneeze at.