This post is part of a series highlighting the summer projects from our office’s undergraduate research assistants. This post is by Michael Brackett, a senior majoring in Meteorology and minoring in Mathematics at NC State University.
Coastal ecosystems such as estuaries are highly sensitive to changes in weather and climate. Because of this, the Strategic Estuarine Research and Development Program (SERDP) supports research and monitoring projects that support these ecologically and economically important ecosystems. One such project is the Defense Coastal/Estuarine Research Program (DCERP), which studies the impact of climate on ecosystems in areas controlled by coastal military bases such as Camp Lejeune.
As part of the DCERP project, the State Climate Office was tasked with identifying appropriate historical estimates for ecological modelers. There are a wide variety of gridded historical estimates of temperature, wind speed, and other important weather parameters. It is important for DCERP to know which most closely match the historical station-based observations as it will provide ecologists with the best choice for assessing the response of coastal ecosystems to the climate.
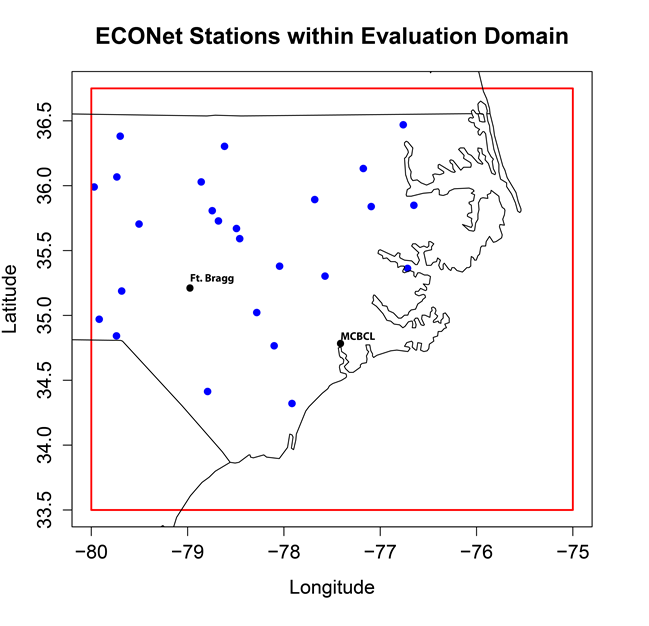
For my project this summer, I evaluated three historical datasets that contain gridded estimates: PRISM, NLDAS-2, and U of I METDATA. These datasets all offer estimates of temperature, precipitation, and other variables, but are created using different statistical modeling techniques. For the evaluation, I focused on eastern North Carolina, specifically the Marine Corps Base Camp Lejeune area, and used ECONet station observations to test the consistency of the historical datasets.
To determine which historical dataset’s gridded estimates were most similar to the station-based observations, I used many statistical evaluation metrics, including the calculations of bias, correlation, RMSE, and probability distribution functions.
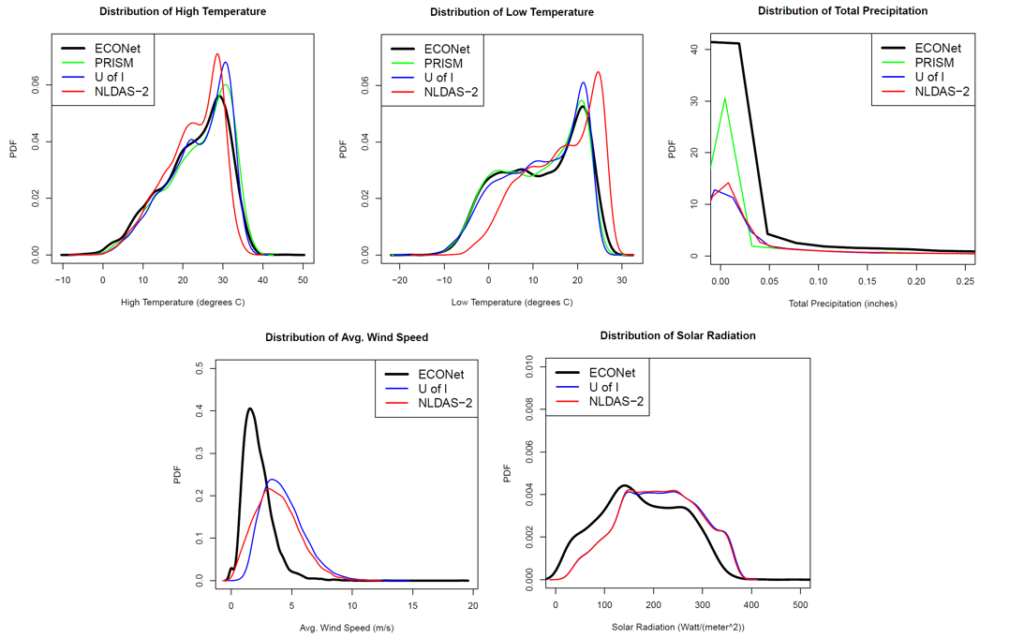
Looking at the results from the probability distribution functions, we were able to see that the distribution of the PRISM dataset estimates most closely matched the distribution of the observed station data for maximum temperature, minimum temperature, and precipitation. This can be seen in the top three figures shown below where the PRISM dataset’s distribution hovers near the ECONet observation’s distribution. In addition, the PRISM dataset also had the highest correlation values with the ECONet observations for maximum temperature, minimum temperature, and precipitation.
As for the wind and solar radiation parameters, we found the NLDAS-2 and U of I METDATA estimates were very similar when compared to each other, but not very consistent with the ECONet station observations. Examining the bottom two figures below, this is evident as the NLDAS-2 and U of I METDATA distributions closely match each other, but do not really follow the ECONet distribution. This can again be seen in the correlation values, where both the NLDAS-2 and U of I METDATA have similar values that show only moderate correlation.
From the results of this project, we will propose to the DCERP research team that the PRISM dataset be used for temperature and precipitation estimates. As for the wind and solar radiation estimates, we were hoping to find more consistent results. However, it seems neither the NLDAS-2 or U of I METDATA dataset is truly better than the other so either of these datasets will be acceptable. These results are an important preliminary step in DCERP’s goal of protecting these coastal and estuarine areas as now they know which datasets provide the best estimates for modeling future climate impacts.
If you are interested in knowing more about this program, visit the DCERP webpage for more information.