Summer Projects: Soil Temperature Quality Checking
This post is part of a series highlighting the summer projects from our office’s undergraduate research assistants. This part of this series is by Madeline Pope, who is finishing her degree in Environmental Science and a minor in Meteorology at NC State University.
Farmers till it. Baseball players slide in it. Golfers put divots in it. You let it run through your toes on the beach. Soil affects all of us in one way or another.
At our ECONet stations across the state, sensors collect soil temperature data, among other parameters. The temperature of soil in an area may be important to farmers and scientists concerned about plant growth, germination of seeds, aeration, soil moisture, or availability of plant nutrients.
Once this data is collected, it is important that we quality control it, or “QC” it, so that the information that we provide is accurate. The QC is completed through automated scripts that catch values that might be erroneous, and then we manually check those values each day to ensure accuracy. Over the past year, we have worked on creating a new automated routine to better check soil temperature.
Variables that Affect Soil Temperature
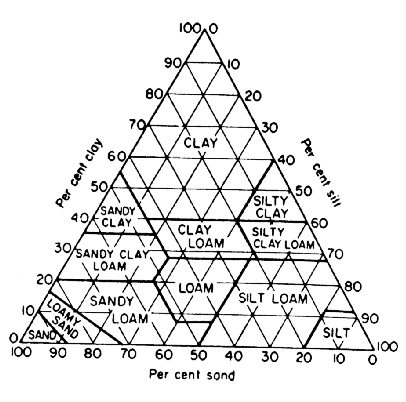
We wanted to identify factors that would influence soil temperature, which led us to investigate air temperature and soil type. Air temperature would be a contributing factor because of its direct correlation to soil temperature. We also assumed that soil type would have an effect because of pore size and moisture capacities.
To test how much influence each characteristic had, we looked at linear approximations between air and soil temperature for 3 different soil types in 4 seasons. Linear approximations, or regressions, are equations of a line that help describe a correlation between two different variables. Those regression models allowed us to estimate the soil temperature by knowing the air temperature. To tell how well these models performed, we calculated residuals, which are the difference between observed and experimental values.
Applying Regressions to Different Stations
We also wanted to know if the linear regressions for one station could be used on another station with the same soil type.The same approximations found for the original stations were applied to three different stations with the same soil type. Residuals were calculated for experimental and observed values at those stations as well, and the results were analyzed.
Results indicated that seasonal linear approximations worked well for a station’s particular location, but not for a different station with the same soil type. Comparisons showed that Spring and Fall months tended to have a stronger correlation with soil type than Winter and Summer months. It was apparent that soil type was not a large contributing factor in quality checking soil temperature.
For Each Station, For Each Season
Knowing that we needed a separate linear approximation for each station, we created regression models for each station, each season.
To observe the accuracy of these models, residuals were once again calculated between experimental and observed soil temperature values on a minute time scale.
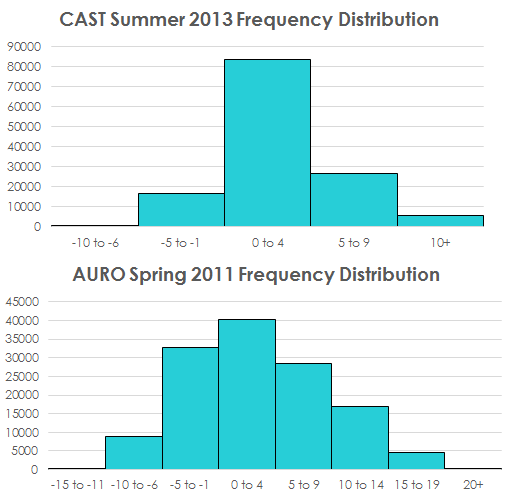
The average residuals were very small (between 0 to 4 degrees Fahrenheit in most cases), which told us that the models generally performed well.
For each station and each season, we summarized the results in frequency distributions of the residuals, as the example above shows. The distributions told us how often the regressions were performing correctly, which meant the residuals were near zero. They also told us how many outliers, or poorly estimated values, were in our data. After analyzing the distributions, we were able to adjust the models as needed. For example, if a regression model was consistently under/over predicting soil temperature, we would adjust the regression accordingly.
Our Next Steps
At the moment, we are writing a script within our QC code that will take into account our research on the matter, and will make checking soil temperature much easier. Hopefully, anyone who uses soil temperature data will benefit from this research, and will reassure those individuals that the data they are receiving is top quality!
If you have any questions about soil temperature or quality controlling data, please feel free to contact the State Climate Office.
- Categories:


