Summer Projects: Predicting Pine Productivity with Drought Indices

This post is part of a series highlighting the summer projects from our office’s undergraduate research assistants. This part of this series is by Colin Loftin, who is finishing his degree in Meteorology and a minor in Mathematics at NC State University.
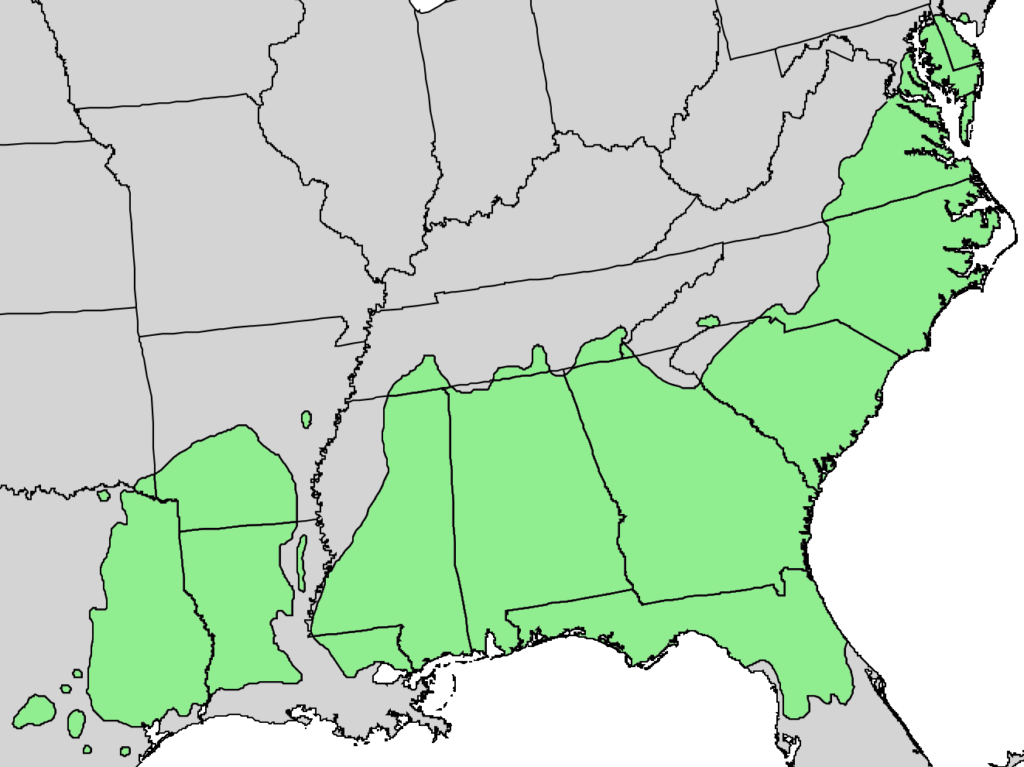
Drought is an important subject, and given the conditions in the western part of the country, a timely one. Drought is also important to growers, and as collaborators on the PINEMAP project, which is studying loblolly pine growth in the southeastern US, we wanted to investigate the historical impact of drought on pine productivity.
The goal of this study was to determine, through simple statistical comparisons, whether a relationship exists between the numerous drought indices, and yearly Total Net Primary Production (TNPP) which was provided by researchers from PINEMAP. If relationships were in fact present, the second goal was to determine which drought index was the best predictor of yearly TNPP.
The drought indices examined were the Palmer Drought Severity Index (PDSI), the Palmer Hydrological Drought Index (PHDI), the Palmer Z Index (ZNDX), the Modified Palmer Drought Severity Index (PMDI), and the Standardized Precipitation Index (SPI) calculated at 1, 2, 3, 6, 9, 12, and 24 month intervals. After completing the comparison of these indices, we also looked at the effect of precipitation — yearly and warm-season (April-October) averages — on TNPP.
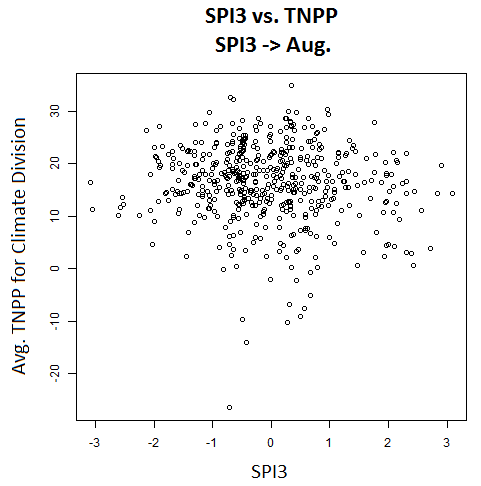
For an initial analysis, correlations were calculated across the entire PINEMAP region. The correlations calculated for this set were all quite low, with most R values ranging between 0 and -.17.
Since there were not strong correlations with the first set, correlations between the TNPP yearly averages and the drought indices were calculated at a finer spatial scale: climate division level. These correlations varied wildly between climate divisions. Unfortunately this is likely due to a lack of data in most climate divisions. The longest period of record in any climate division was 25 years, with most climate divisions having less than 15 years of data.
Precipitation was also compared with the TNPP values, however the results were much the same as the drought indices. It was suggested to us by Ge Sun, a Research Hydrologist with the US Forest Service, that the minimum precipitation threshold for pine growth is around 700-800 millimeters per year. In almost every single year and climate division considered, annual precipitation exceeded this threshold. If the pine trees in the areas studied were regularly receiving sufficient rainfall, this could be a main reason why this study’s correlations were so low. Guidance from PINEMAP researchers suggested that fertilizer use is an even more significant predictor of growth than precipitation.
Based on the data and results from this study, any connection between precipitation or drought indices and pine productivity is weak or negligible. While unlikely, it is possible that a relationship does exist when viewed at the climate division level, but unfortunately, a lack of data makes it difficult to draw this conclusion with any confidence. In the future, examining these relationships on a more localized scale as well as having a longer period of data could allow for stronger conclusions to be made. It would also be interesting to take into account factors such as fertilizer use or harvests.
- Categories:


