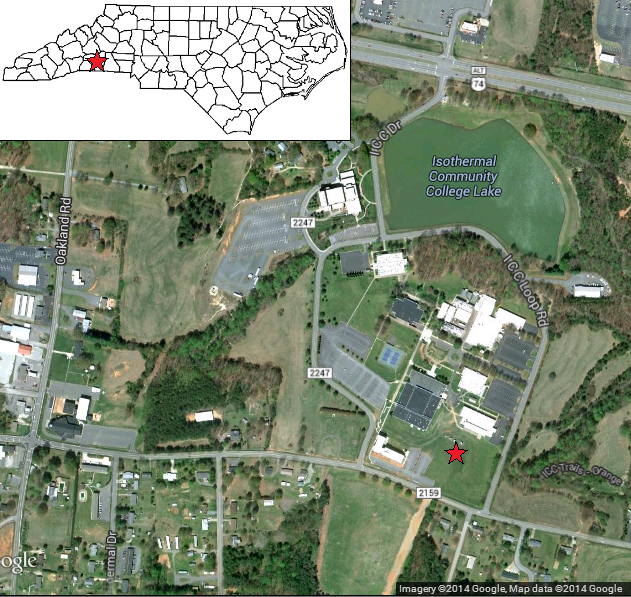
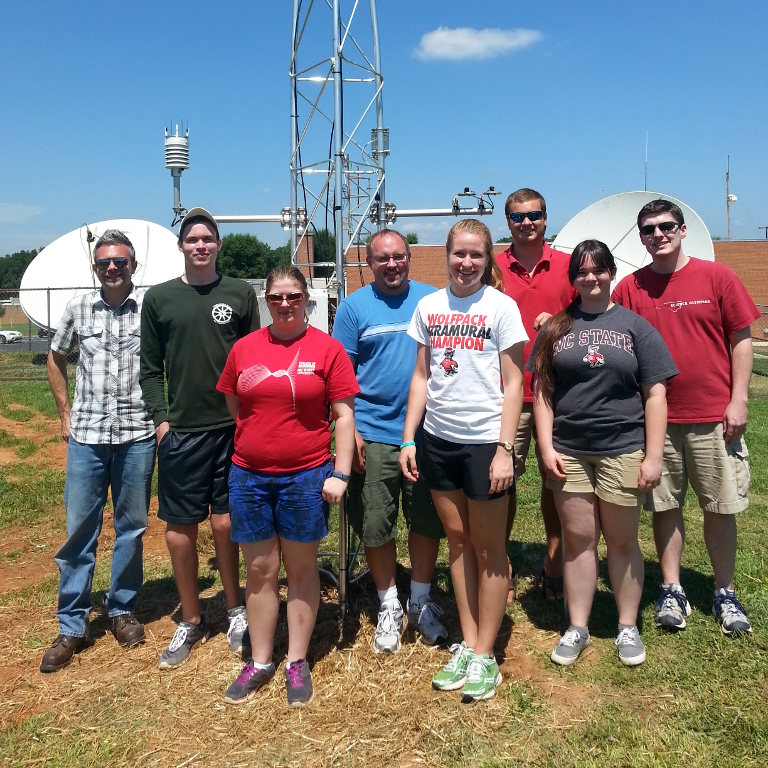
Last week, a team of nine staff members and students from our office completed the installation of our 38th ECONet weather station. This new station is in Rutherford County on the campus of Isothermal Community College in Spindale, NC. Here is a closer look at this site and how we install a new weather station.
Background
In July 2013, Facebook expressed interest in climate monitoring near their data center in Forest City, NC. Their data center is largely cooled using the outside air, and so weather observations from the area are important. Facebook also has a commitment to supporting engagement with the local community.
Working with colleagues at the NOAA National Climatic Data Center (NCDC) and the NCSU Cooperative Institute for Climate and Satellites – NC (CICS-NC) (both based in Asheville, NC), the Facebook Data Center (in Forest City, NC), and Isothermal Community College (ICC) (in Spindale, NC), we agreed that an ECONet station located at Isothermal Community College would meet the common interests in collecting high quality climate data for the broader community benefit. Funding for initial sensor installation was provided through a grant from Facebook to Isothermal Community College, with ongoing support for educational programs provided by NOAA NCDC through CICS-NC.
Installation
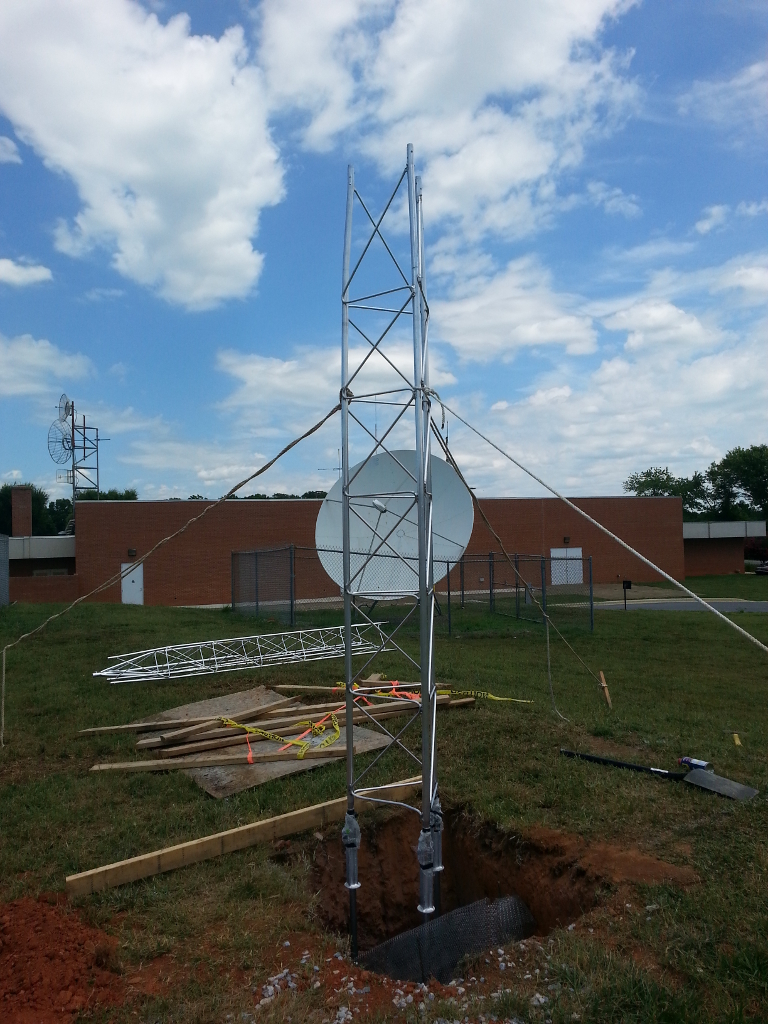
The station installation began several weeks ago, when we set up the three-meter tall tower base and concreted it into the ground. When we returned to the station last Thursday morning, we made sure the base was still level, then continued with the installation.
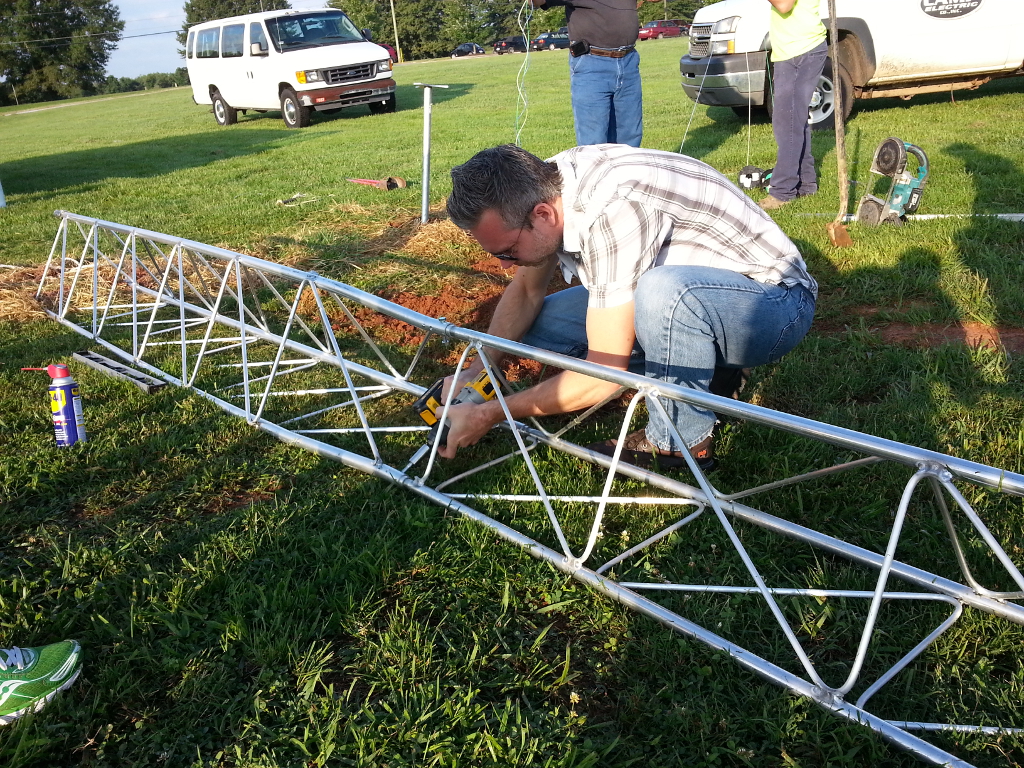
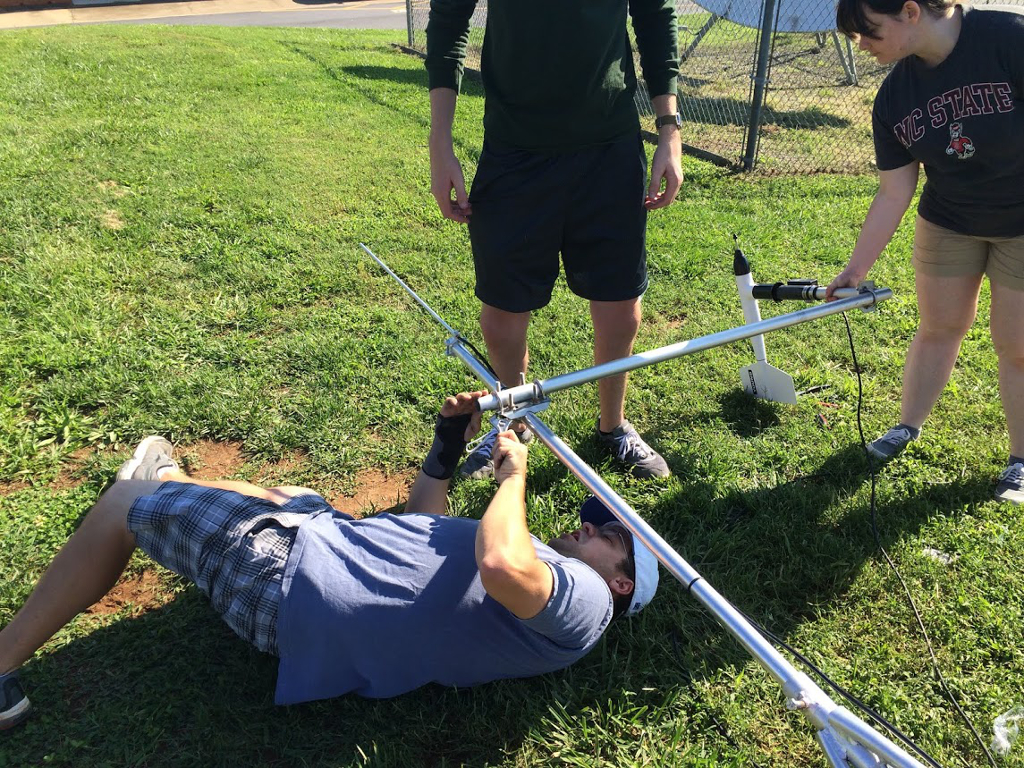
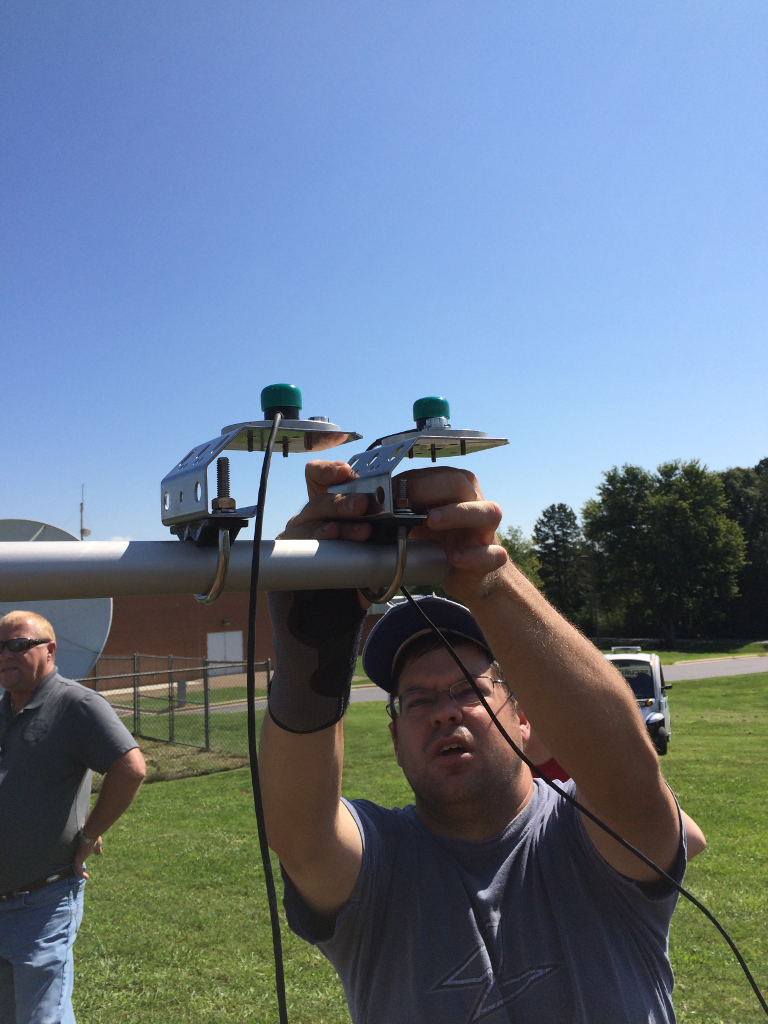
First, we bolted on two tower extensions to get it to a height of 10 meters. We then added propeller anemometers to measure wind speed at the standard 10 meter height and at the 6 meter height. This 6-meter wind data is used in our fire weather monitoring to help estimate the rate a fire might spread along the crowns of trees about 6 meters above the ground.
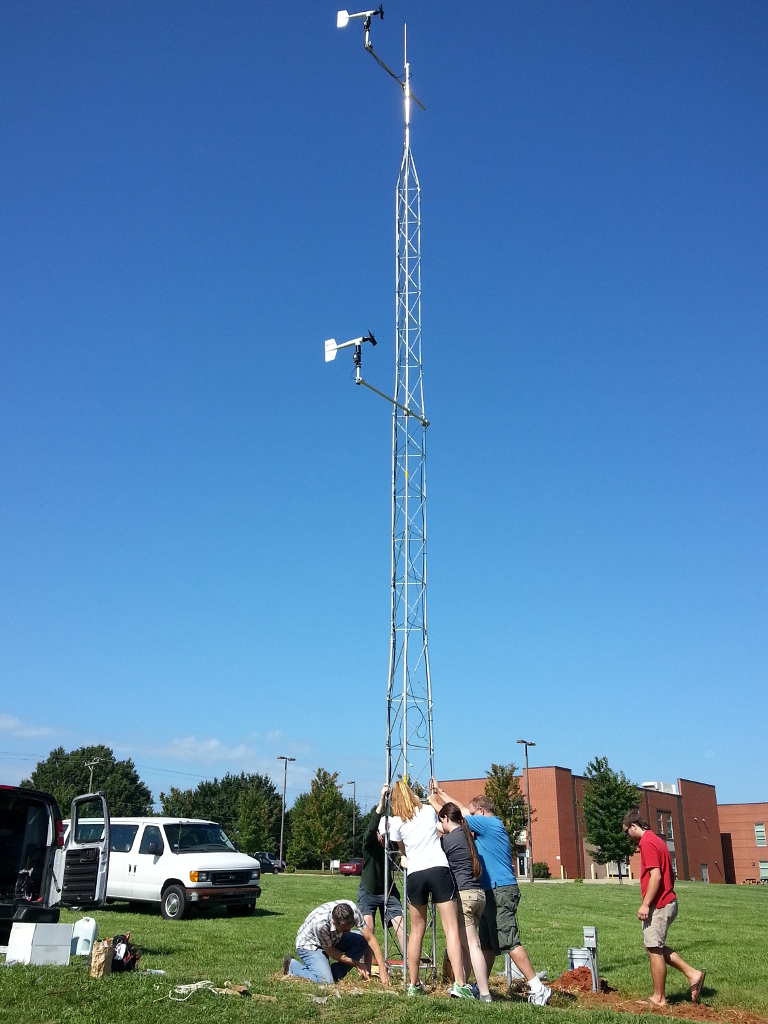
With the wind sensors in place, we raised the tower and made sure everything remained level. Work then turned to the lower levels on the tower and even below the ground. At the two-meter level, we installed pyranometers that measure incoming solar radiation and photosynthetically active radiation, which is a particular range of wavelengths used by plants for photosynthesis.
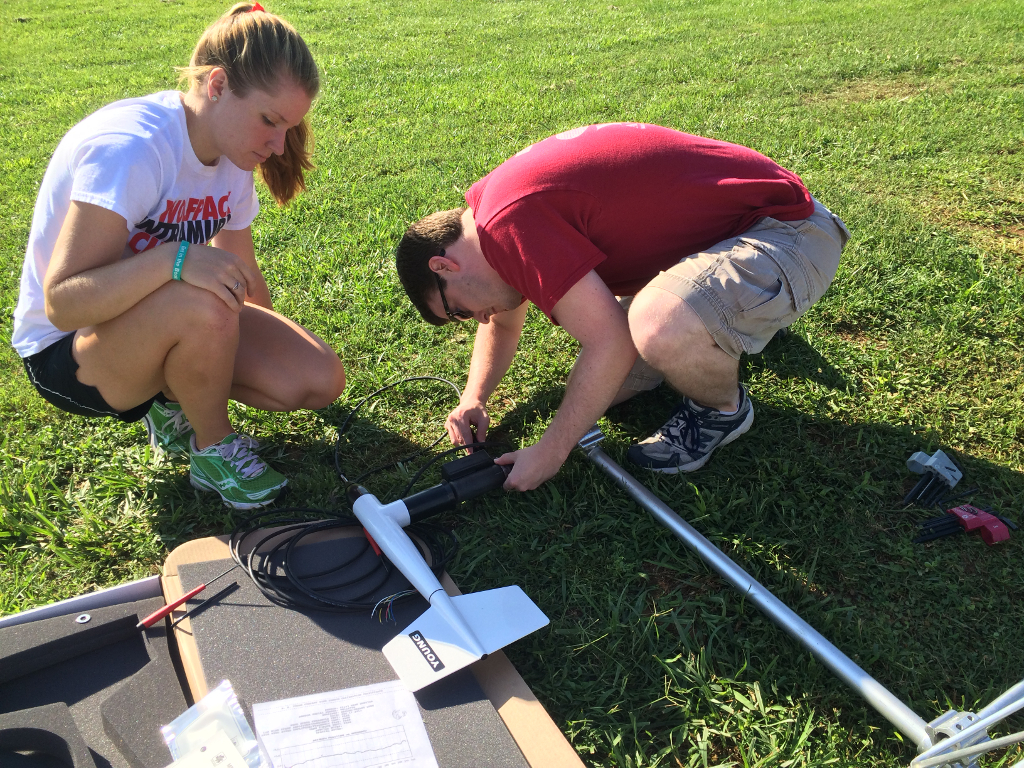
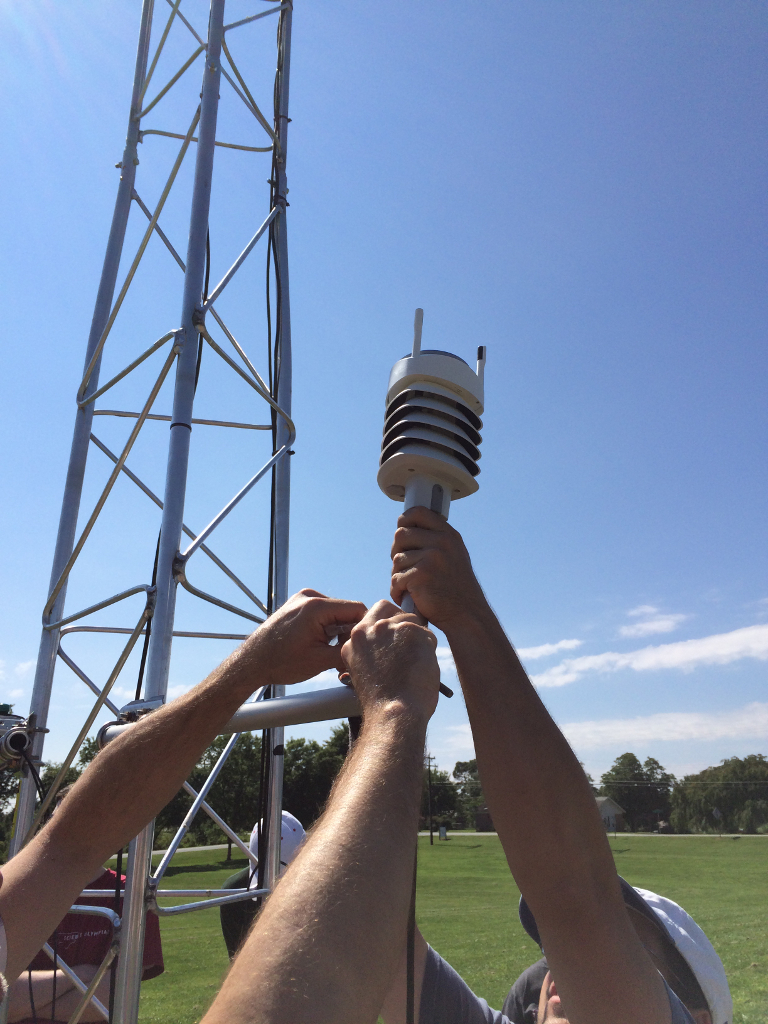
We also installed an all-weather sensor, which includes sensors for temperature, relative humidity, and air pressure within the white gill shield; a precipitation impact sensor on top; and a sonic anemometer, which measures wind speed and direction by tracking how long sonic pulses take to travel between the three prongs atop the sensor. Farther down the tower, we installed a leaf wetness sensor, which is used in agricultural monitoring.
Near the tower, we buried a grounding rod, which connects to the lightning rod atop the tower. As this slow-motion animated GIF shows, it required a pile driver and some mighty force to bury. Although a lightning rod doesn’t prevent all lightning strikes to our stations — as we learned when our Greensboro station was struck and had its wind sensor fried in 2009 — it does keep most of our sensors protected during storms.
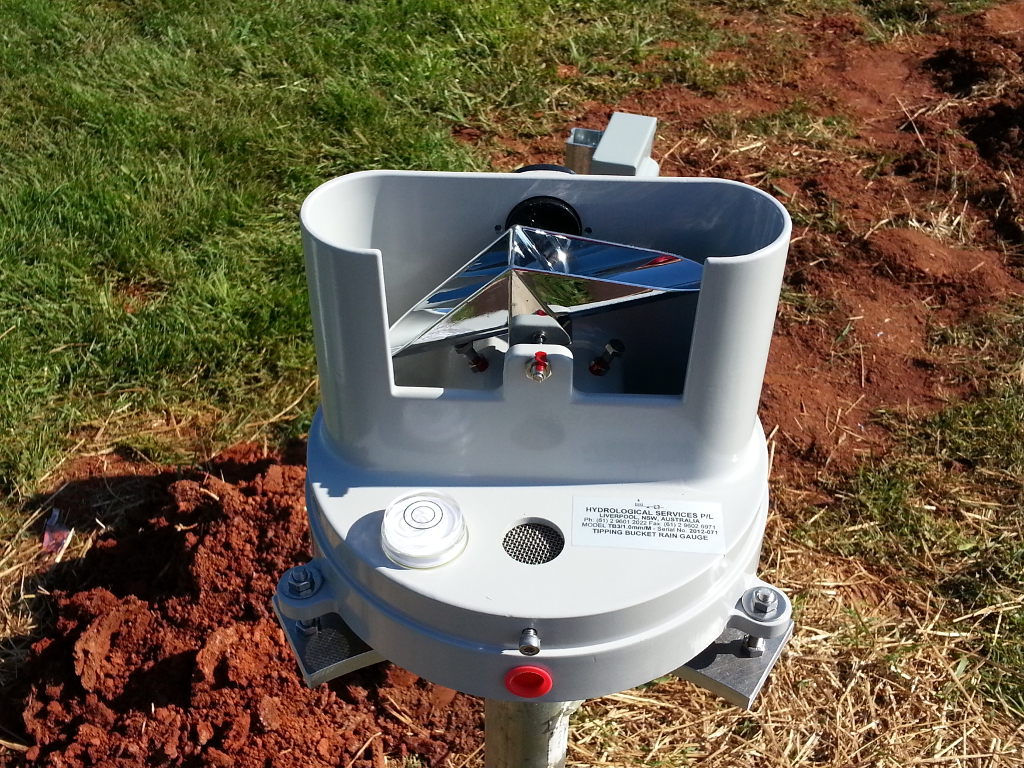
Several feet from the tower, we installed a tipping bucket rain gauge, which tracks precipitation by counting how many times the level tips back and forth: Each tip means one one-hundredth of an inch of precipitation has fallen.
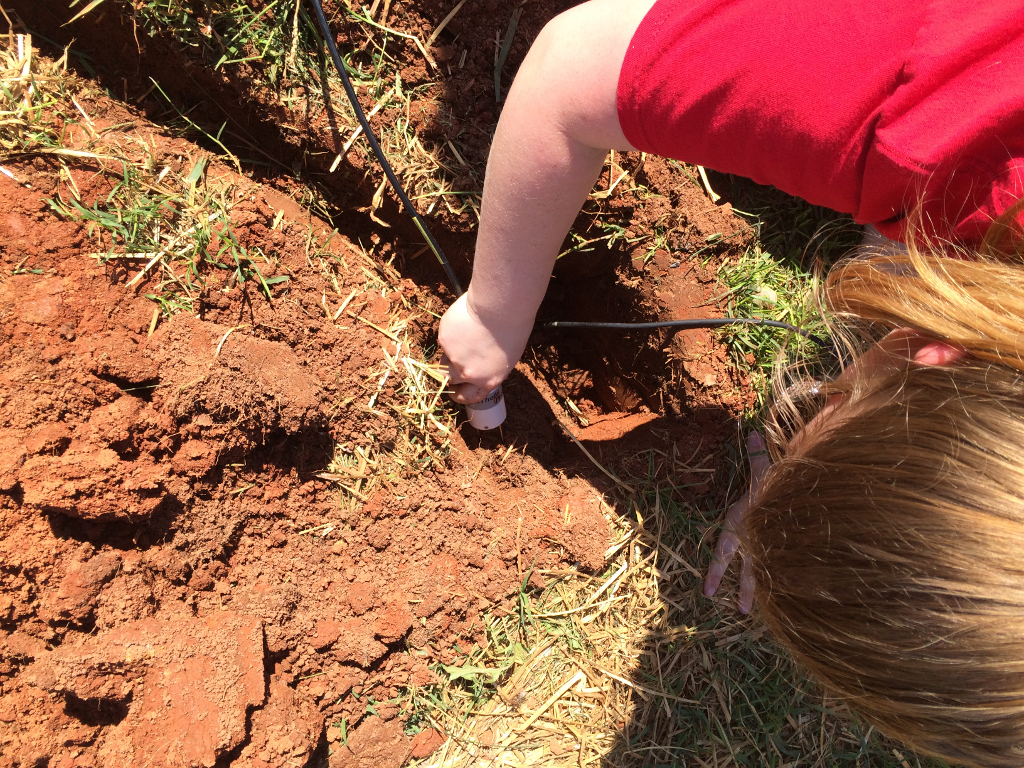
Several inches below the ground, we installed soil temperature and soil moisture sensors, which are important for agricultural applications and are used by forecasters to determine whether frozen precipitation may stick to the ground or roads.
We recap the six-hour installation in just two-and-a-half minutes in this video montage.
Getting the Data
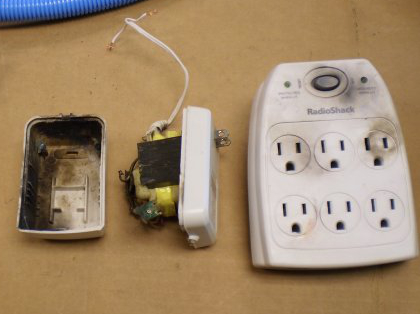
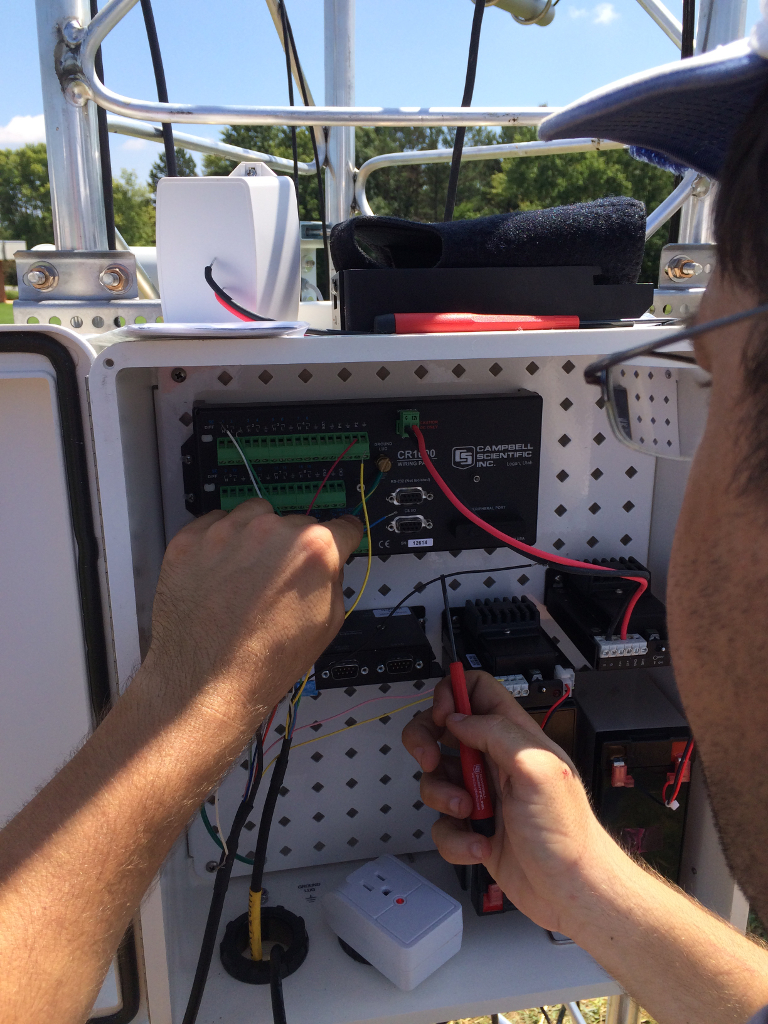
All of the sensors, along with electrical power, are connected into the data logger box. At this station, we installed a wireless transmitter to send the data to us every five minutes via ICC’s wireless network. At stations where Internet access isn’t available, we use dial-up modems that call our office every 30 minutes to report the data.
You can view the data from this station — assigned the identifier SPIN for the town of Spindale — on its data retrieval page and on many of our map products.
Thanks to Isothermal Community College for assistance with the installation and to Sam Roback, Geneva Ely, and Sean Heuser for supplying photos and video for this post.