In our previous post, we looked at the importance of fire to ecosystems in North Carolina. Today we conclude this series on drought and fire by looking at a tool designed to help with monitoring weather and fire risk conditions across the state.
Each spring, the risk of wildfires starting across North Carolina increases as temperatures rise, thunderstorms develop, and trees and other vegetation dries out. For groups such as the North Carolina Forest Service, it is important to be able to monitor weather and fire risk conditions across the state in real-time. To meet this need, our office developed the Fire Weather Intelligence Portal.
Portal Features
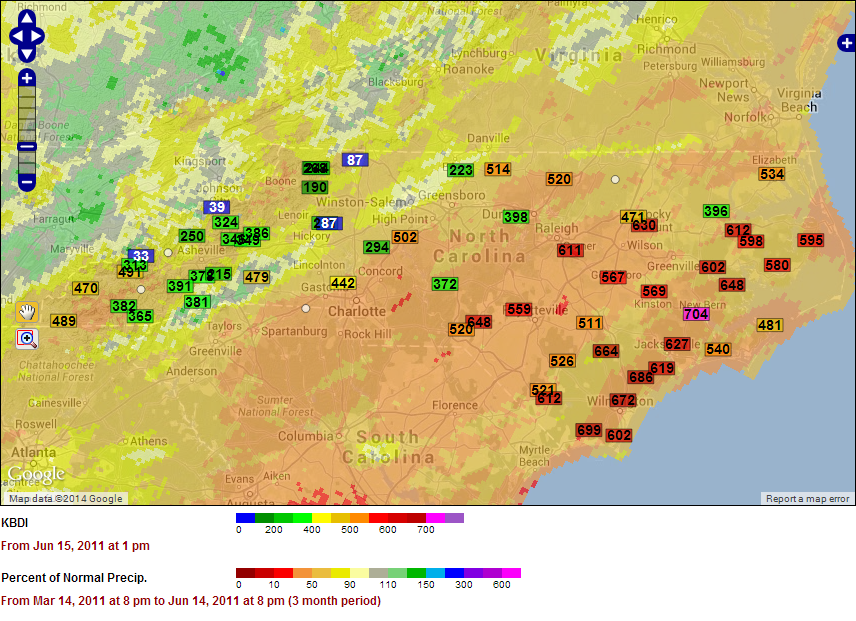
The Portal allows users to view past, current, and forecast conditions using both point-based and gridded datasets. Point-based data includes the standard meteorological output from weather stations — parameters such as air temperature, precipitation, and winds — as well as commonly-used fire risk parameters from the National Fire Danger Rating System (NFDRS) that are calculated using the weather data. This fire risk information includes fields such as the Keetch-Byram Drought Index (KBDI), which is an indicator of dryness in the soil, and the Energy Release Component (ERC), which is related to dryness in sticks, logs, and other fuels for wildfires.
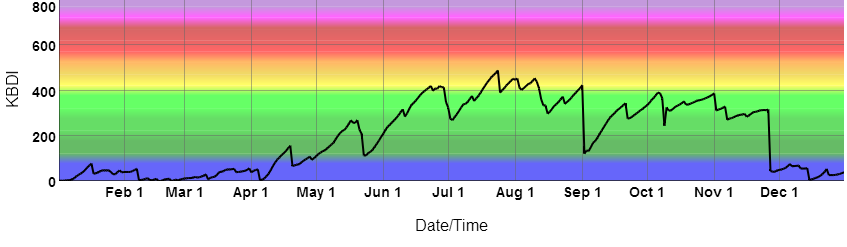
By calculating these parameters at our ECONet weather stations and some airport-based ASOS and AWOS weather stations, we have increased the density of the available data to give better local estimates of fire risk. Portal users can also view a recent history of these point-based parameters by clicking on a station, which brings up a meteogram — or graph of historical data — below the map.
We also added useful gridded datasets including forecasts for fire-specific fields such as mixing height, atmospheric dispersion and ventilation indices, and the Low Visibility Risk Index (LVRI). These gridded datasets provide localized guidance that can help foresters determine, for instance, if they can safely conduct a prescribed burn with limited smoke- or fire-related impacts to the public.
Future Developments
We are actively working to make the Fire Weather Intelligence Portal even better and more useful. This includes potentially providing guidance up to a month in advance for times with heightened fire risk. Recent research at our office looked at the connections between several NFDRS indices and climatic indicators such as global climate pattern indices and regional drought indices.
The results showed that during the spring and summer, there are some fairly strong relationships between short-term drought indices (including the one-month Standardized Precipitation Index) and both KBDI and ERC. By knowing which drought conditions have historically preceded times of elevated fire risk, we may be able to provide alerts that inform users when current conditions suggest an impending time of heightened risk. This could help the Forest Service and other groups prepare their resources for potentially active periods.
Thanks to our partners at the NC Forest Service for their feedback and assistance with the Portal’s development, as well as the helpful data providers at the Southern High Resolution Modeling Consortium, the National Weather Service office in Greer, SC, the Missoula Fire Lab, and the National Wildfire Coordinating Group.