Drought Communications
From 2018 through 2020, the North Carolina State Climate Office and the Carolinas Integrated Sciences and Assessments (CISA) partnered on a NOAA-funded project aimed to increase the transparency and effectiveness of drought communications in North Carolina.
This project, titled Innovating Approaches to Drought Communications with North Carolina Decision Makers, included developing resources to present weather and drought information in formats such as infographics and factsheets that are usable and useful for our target sectors: agriculture, forestry, and water resources. Examples of these resources are shared below.
For an overview of our work on this project, nicknamed Project Nighthawk, read our project summary or our full report.
Drought Update Infographics
Each week, North Carolina’s drought status is discussed and updated by the North Carolina Drought Management Advisory Council (NC DMAC) and the US Drought Monitor’s authors. These graphics help explain the reasoning behind the drought status and impacts being felt across the state.
The archive below includes drought updates through August 2020, including during the “flash drought” of fall 2019. More information about the indicators used in North Carolina’s drought monitoring process can be found in this storymap.
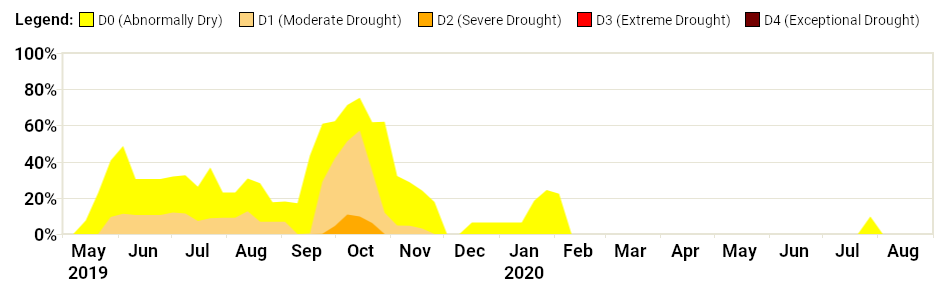
Drought coverage in North Carolina by percentage area from May 2019 through August 2020 — the period over which drought update infographics were developed:
More information about Drought Update Infographics, in PDF format:
Historical Drought Factsheets
No two droughts are exactly alike, so understanding how various historical droughts have played out — including their causes, impacts, severity, and how they ended — can help show the range of possibilities and provide a reference point during an ongoing drought event. These factsheets provide a timeline, narrative, and statistics for different past droughts focused on various sectors and regions of the state.
Short-Range Outlooks
When surveyed early in the project, stakeholders from our target sectors overwhelmingly indicated that understanding current, short-term, and medium-range weather conditions was important to their work and preparations, especially in times of drought. By packaging weather forecasts from the National Weather Service into these one-page graphics, we provided accessible, actionable guidance over the next 1 to 4 weeks.
Example Outlooks, in PDF format: (these are not current forecasts)
- From June 2019
- From April 2020
- From August 2020
More information about Short-Range Outlooks, in PDF format:
Project Background
In the aftermath of recent droughts in North Carolina, including the exceptional drought of 2007-08, decision makers across the state articulated their needs for information and communications that enhance and improve upon existing resources. These needs include a better understanding of how drought is monitored, the environmental conditions that can cause or worsen a drought, and drought impacts on various sectors including agriculture, forestry, and water resources. This project focused on improving the usability of drought-relevant information for North Carolina decision makers based on needs identified by the NC Drought Management Advisory Council and constituents such as Cooperative Extension agents and public water supply system managers.
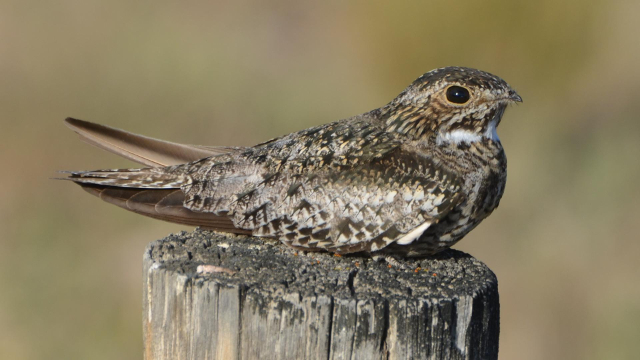
Our project became known as Project Nighthawk. Why Nighthawk? We took this name and inspiration from nature. The common nighthawk, or Chordeiles minor, is a bird species native to North Carolina. When it comes to drought response, though, these birds are anything but common. Every aspect of a nighthawk’s life can be affected by drought:
- They lay their eggs not in a nest but on bare ground, so even in forested areas, temperature and precipitation extremes can limit their ability to incubate eggs at night or cool them during the day (Albright et al., 2010).
- Males roost in trees to keep watch over the nests, so drought impacts such as wildfire can indiscriminately destroy their closely guarded habitats (Fisher et al., 2004).
- They feed on aquatic insects, so hydrological drought conditions can limit the availability of their major food source near ponds and streams (Environment Canada, 2016).
Despite those impacts, the common nighthawk has been observed as one of the first creatures to return to drought- and fire-affected areas (Robertson, 2016). Indeed, they’re one of nature’s best examples of drought resilience.
Just as the common nighthawk has learned to live with and recover from drought, our goal in Project Nighthawk was to help decision makers across North Carolina become better informed about and prepared to respond to drought and the weather and climate patterns that can cause and alleviate it.
In this project, our specific objectives were to:
- develop tailored, sector-specific information relevant for drought-related decision points,
- deliver information in accessible and usable formats, and
- improve the transparency of the drought monitoring process through enhanced engagement and communication with decision makers.
Project Phases
Our project included five phases of iteratively engaging with stakeholders, developing resources, and sharing our results:
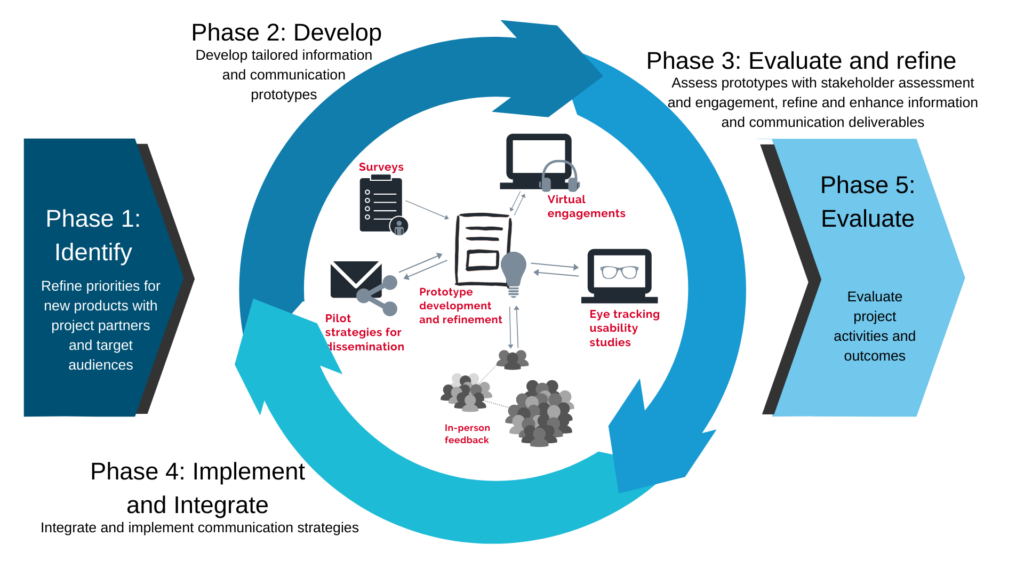
Phase 1: Identify
Through surveys and webinars with our target sectors, we assessed stakeholders’ perceptions of drought, information needs and communication preferences, and identified priorities for new resources. For more on this part of the project, read our two-page summary or full writeup.
Phase 2: Develop
We created initial prototypes of prioritized resources such as our drought update infographics and short-range outlooks. For more, read our two-page summary from spring 2019.
Phase 3: Evaluate & Refine
During webinars and in-person meetings, we assessed our prototypes with stakeholders using focus group discussions and eye tracking studies. Based on this feedback and the testing results, we refined the resources to be more usable and useful. We began regular distribution of our drought infographic and short-range outlook resources with a group of volunteer pilot testers
Phase 4: Implement & Integrate
We reconvened with key partners and sectoral representatives on a final set of webinars to get additional feedback on our revised resources, including how they were being implemented within our stakeholders’ existing communication and planning strategies. In this phase, we also continued to share our results and lessons learned at various national conferences and state-level meetings with our target sectors, including:
- NC DMAC Annual In-Person Meeting, April 2019 (slides)
- NC Fire Environment Committee Meeting, May 2019 (slides)
- Catawba-Wateree DMAG Annual Meeting, June 2019 (slides)
- US Drought Monitor Forum, September 2019 (slides)
- American Meteorological Society Annual Meeting, January 2020 (slides)
Phase 5: Evaluate
Through final surveys with extension agents and resource managers, we evaluated the effectiveness of our project and deliverables and assessed their current and potential usage of the newly developed resources.
Acknowledgements
This project was made possible because of Climate Program Office FY 2018 funding opportunity NOAA-OAR-CPO-2018-2005133 in the Sectoral Applications Research Program (SARP) “Coping with Drought in Support of the National Integrated Drought Information” competition, with a focus on “improving/enhancing decision making through improved and varied communication techniques such as through the use of social media” (Grant No. NA18OAR4310258).
Funding to support CISA’s involvement came from the National Oceanic and Atmospheric Administration’s (NOAA) Climate Program Office and Regional Integrated Sciences and Assessments (RISA) program (Grant No. NA16OAR4310163) and the National Integrated Drought Information System (NIDIS).
We thank our key partners for their support in offering meeting time for discussion and their involvement in all phases of the project. These partners include the NC Drought Management Advisory Council, the NC Division of Water Resources, the NC Cooperative Extension Service, and the NC Forest Service and Fire Environment Committee.