In North Carolina, we had a little bit of everything this winter, from frozen precipitation to severe storms, and from single-digit low temperatures to highs pushing 80 degrees. We have highlighted some of this winter’s interesting statistics in this post.
The rankings for the meteorological winter — December, January and February — show that North Carolina had its 62nd coldest and 45th wettest winter out of a 119-year period of record. However, those numbers don’t tell the full story, as this winter was anything but average.
Other statistics show just how variable our temperatures were: Based on mean temperature standard deviations, this was the 2nd-most variable winter in Charlotte, the 3rd-most variable in Asheville, and the 7th-most variable in Wilmington.
The extremes on both ends of the temperature spectrum were impressive. Raleigh had 5 days with high temperatures below 32°F, which was tied for the 5th-most all time and the most since 1990. Charlotte’s 4 days with high temperatures below freezing was tied for the 2nd-most all time, and also the most since 1990. Complementing these cold days, Raleigh and Charlotte each had 6 days with high temperatures above 70°F during December, January, and February.
During the winter, we had a statewide low temperature of -24°F, set on January 7th at Mount Mitchell. The statewide high temperature this winter was 82°F, set on December 6th and December 22nd in New Bern, December 23rd in Kinston and Whiteville, and February 21st in Whiteville. Also on February 21st, there was one confirmed tornado southwest of Goldsboro.
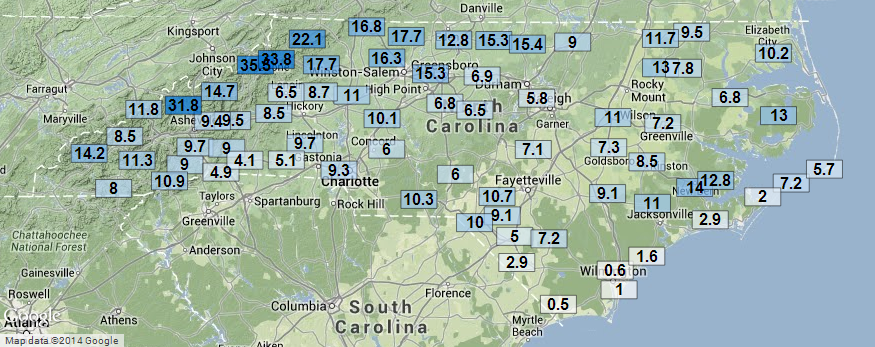
With two to three snow events for all regions but the southern coast, most of the state had near- or above-normal snowfall for the winter. Raleigh had 5.8″ of snow (0.1″ below normal), Charlotte had 9.3″ (compared to the normal of 4.3″), Asheville had 9.7″ (just short of the 9.9″ normal), and Greensboro had 15.3″ (more than double it’s 7.6″ average). All of these totals are substantial increases compared to the past two years, which saw snow totals well below normal. Snow totals from stations across the state are shown on the map above.
Be sure to read our follow-up post for a more detailed recap of our winter, including a review of the seasonal predictions made last fall and an outlook to the spring.