This post is part of a series highlighting the summer projects from our office’s undergraduate research assistants. The fourth part of this series is by Melissa Mainhart, a junior majoring in Meteorology and minoring in Computer Programming at NC State.
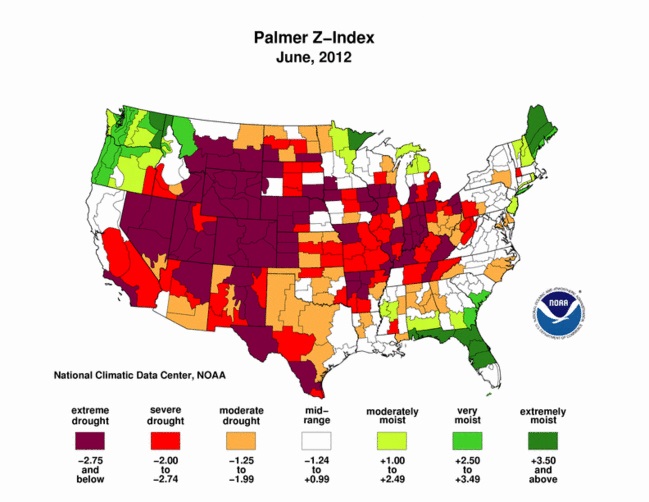
Over the course of the summer I have been working on calculating the Palmer Drought Severity Index using gridded data. The Palmer Drought Severity Index (PDSI) was developed by Wayne C. Palmer in 1965 to measure the severity of a drought or wetness period on a weighted scale.
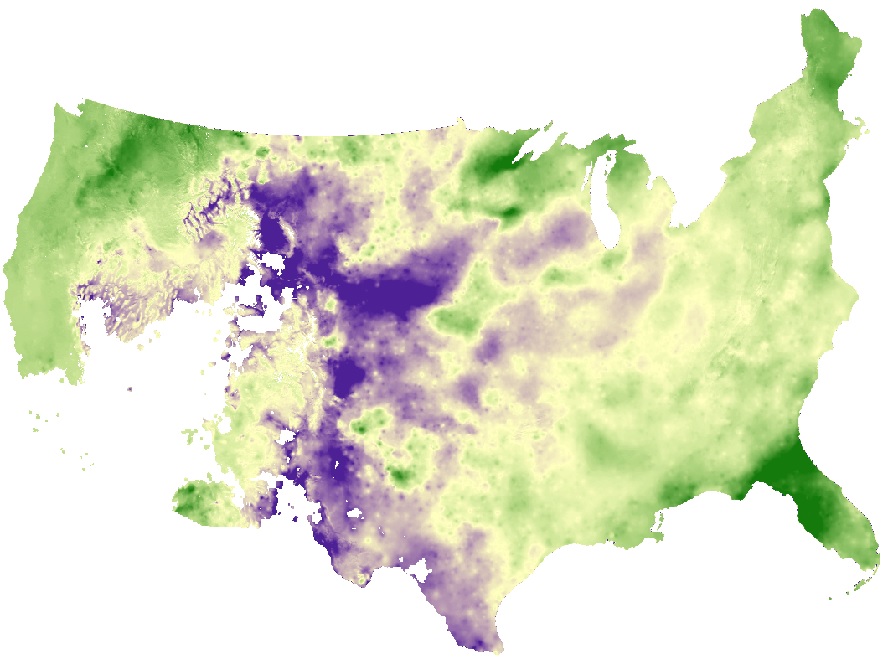
The index traditionally encompasses a range from -3 to +3, with -3 being extremely dry and +3 being extremely wet for any particular month. I am writing computer code that calculates this drought index for a specific month using gridded monthly estimates of temperature and precipitation from MPE (Multi-Sensor Precipitation Estimates) and PRISM (Parameter-elevation Regressions on Independent Slopes Model). Previously this index has only been calculated for a singular data point at a time and the ability to look at each point relative to its surroundings will expand the possibilities of its usage.

When this is finished, we will be able to have readily available high-resolution (4.6km x 4.6km) maps of PDSI for the entire conterminous United States. This will be a valuable tool for law and policy makers as well as those interested in monitoring the moisture conditions within their area. What makes this PDSI unique, as compared to other available maps of PDSI, is its resolution.
Drought is such a spatially dynamic phenomena that we can always gain knowledge and information from looking at drought indexes on increasingly more detailed levels. To be able to say, for instance, that the northeastern section of Wake County, North Carolina is considered neutral with respect to wet or dry, but the central section of Wake County is under a slight drought is an amazing development in drought index calculations.
With this product users will be able to determine the severity of a dry or wet spell in their specific location of interest as well as the areas immediately surrounding them, which may help determine the appropriate measures they take to ensure minimal impacts from drought or increased wetness in their area.

This project is expected to be completed before the end of the year and made available online.