Summer Projects: Leaf Wetness and its Effects
This post is part of a series highlighting the summer projects from our office’s undergraduate research assistants. The third part of this series is by Madeline Pope, a senior majoring in Environmental Science and minoring in Meteorology at NC State University.
Everyone has seen it. You walk outside as the sun is rising and see morning dew covering the front lawn. After a momentary glance, it is forgotten, left to sit on the grass to dry as the sun climbs higher into the sky. Wet grass is not a big part of your day, so why should you care about it? The State Climate Office has the answer!
So what is “leaf wetness”? It is the duration of dew and precipitation that is formed on plants, grasses and crops. Dew is formed on calm nights with few clouds when a surface cools down below the dew point through loss of infrared radiation. It is made from the water vapor that is already in the air. It covers vegetation for a certain period of time, keeping the leaves wet. Dew that covers vegetation for prolonged periods of time can cause plant diseases. If the leaves of a farmer’s crops stay wet for too long, it could affect the outcome of the harvest, making less food for places around the country.
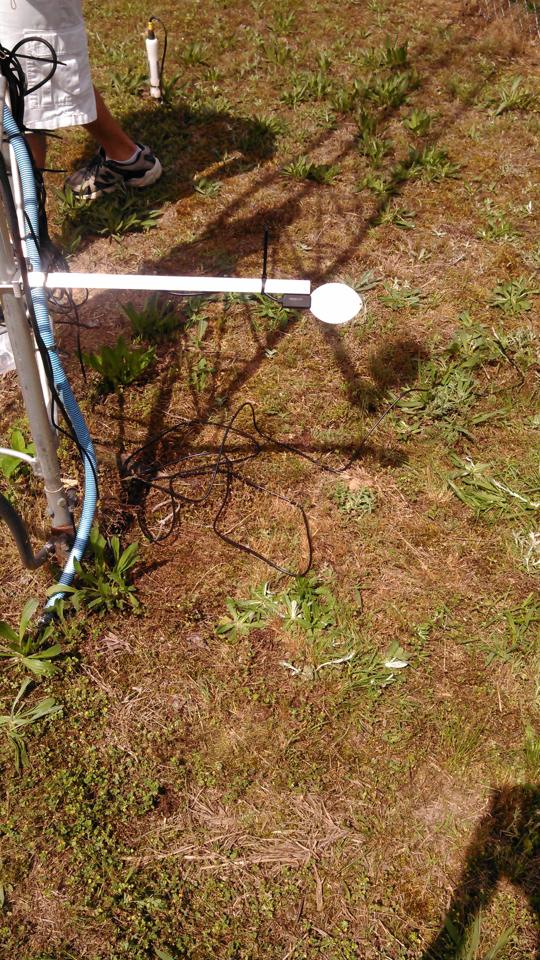
The purpose of this research project was to find a point when a leaf is considered wet, and when it is considered dry. At various times over the summer season, leaf wetness sensors were installed at many of our ECONet stations around North Carolina. These sensors allowed us to explore the threshold of wet and dry leaves.
Finding this threshold proved to be difficult. Previous background research suggested higher threshold values than were yielded in our study. With the guidance of prior studies, we acknowledged that a leaf was wet if the relative humidity (RH) was greater than 90% and the leaf wetness (LW) sensor value was 397 (raw counts) or higher.
If the RH was less than 90% but greater than 70%, the leaf could possibly be wet or dry. If the RH was less than 70% and the LW sensor value was below 397, the leaf was assumed to be dry. To determine the possibly wet or dry values, an algorithm was developed that if RH decreased by 2% in 30 minute blocks, the leaf was probably dry. If the RH increased by 3% in 30 minute blocks, the leaf was probably wet.
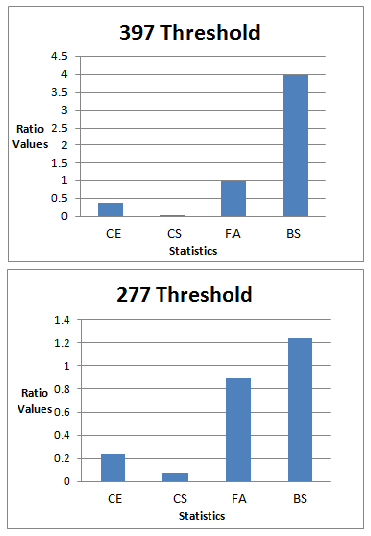
After these limits were established, a program was written to determine values for correct estimate (CE), correct success (CS), false alarm (FA), and bias (BS). It was desired to have bias, correct success and correct estimate ratio values close to 1.0, and to have false alarm values near zero. However, when the algorithm was applied, bias values skyrocketed while correct success values plummeted to near zero. It was obvious that our assumptions were incorrect. The LW threshold was lowered from 397 raw counts to 277, which was as close as the bias would come to being near 1.0. At the 277 threshold, false alarm values decreased by 10%, and correct success and correct estimate increased by 6-8%.
While results were unsatisfying by utilizing differing threshold values from previous studies, the project is still ongoing. Once we have an acceptable threshold value in which we are confident, the next step of research will be to investigate seasonal changes in the threshold number. It will be observed whether the threshold number of varying locations in North Carolina increase or decrease with the changing seasons.
If you’re interested to know more about this topic, or if you have any questions regarding leaf wetness, please contact the State Climate Office.
- Categories:


