Summer Projects: Freeze Risk and a New ECONet Station
This post is part of a series highlighting the summer projects from our office’s undergraduate research assistants. The second post in this series is by Joseph Taylor, a recent graduate with degrees in Meteorology and Marine Science from NC State.
I am currently researching how the El Niño/Southern Oscillation (ENSO) and North Atlantic Oscillation (NAO) affect temperatures in North Carolina. Specifically, I am attempting to quantify freeze risk to crops, such as corn and soybeans, by investigating relationships between ENSO, NAO, monthly average minimum temperatures, and the number of days below a freezing temperature during cool months (i.e., October through April).
This relationship can be used by the agriculture community during future seasons to help determine influences on how well their crops grow and the likelihood that certain diseases will develop. In addition, if the results of this project show a significant relationship between the number of freezes and a forecasted ENSO/NAO phase then farmers can take precautions before planting their crops during that ENSO/NAO phase. This project is expected to be completed by December.
I have also been putting the final touches on the Freeze Risk Tool, which is expected to be published on the SCO website by the end of October. The Freeze Risk Tool was prompted by the killing freeze of 2007. This tool was designed to help farmers prepare for the growing season with useful historical information on the likelihood of a freeze.
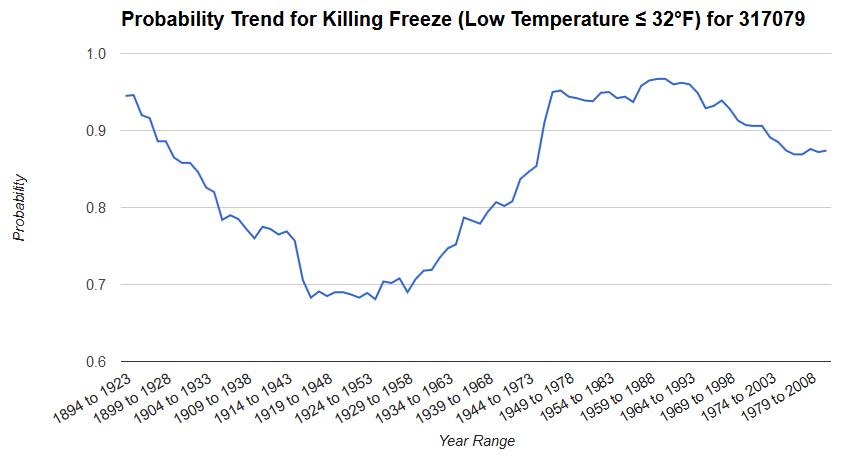
One of the graphs available in the Freeze Risk Tool is the probability trend of a killing freeze on or after the user’s chosen day. This graph is useful for farmers before the growing season since it shows how the likelihood of a freeze has changed in time. For example, the graph to the left shows the probability trend for Raleigh on or after March 14th with a threshold temperature of 32 degrees Fahrenheit.
Other information in the tool includes the percentiles of growing degree days (GDD) and accumulated GDD (shown right). GDDs are days when plant development occurs if the temperature is above the base temperature, which is useful for planters to know a predicted growth stages for their crop. These plots can be used at the beginning of the growing season to determine likely ranges of GDD for a given crop and location — shown as GDD percentiles (top figure) or GDD accumulation percentiles as the growing season progresses (bottom figure).
GDD accumulation is especially important for farmers since it is reflective of the growth of a crop from year to year. Also, a plant starts to flower when it reaches a certain GDD accumulation value and that is when the plant faces the highest risk. These plots are only some of the components included in the Freeze Risk Tool for users to utilize so be sure to check out the website next month when it will be available for public use.
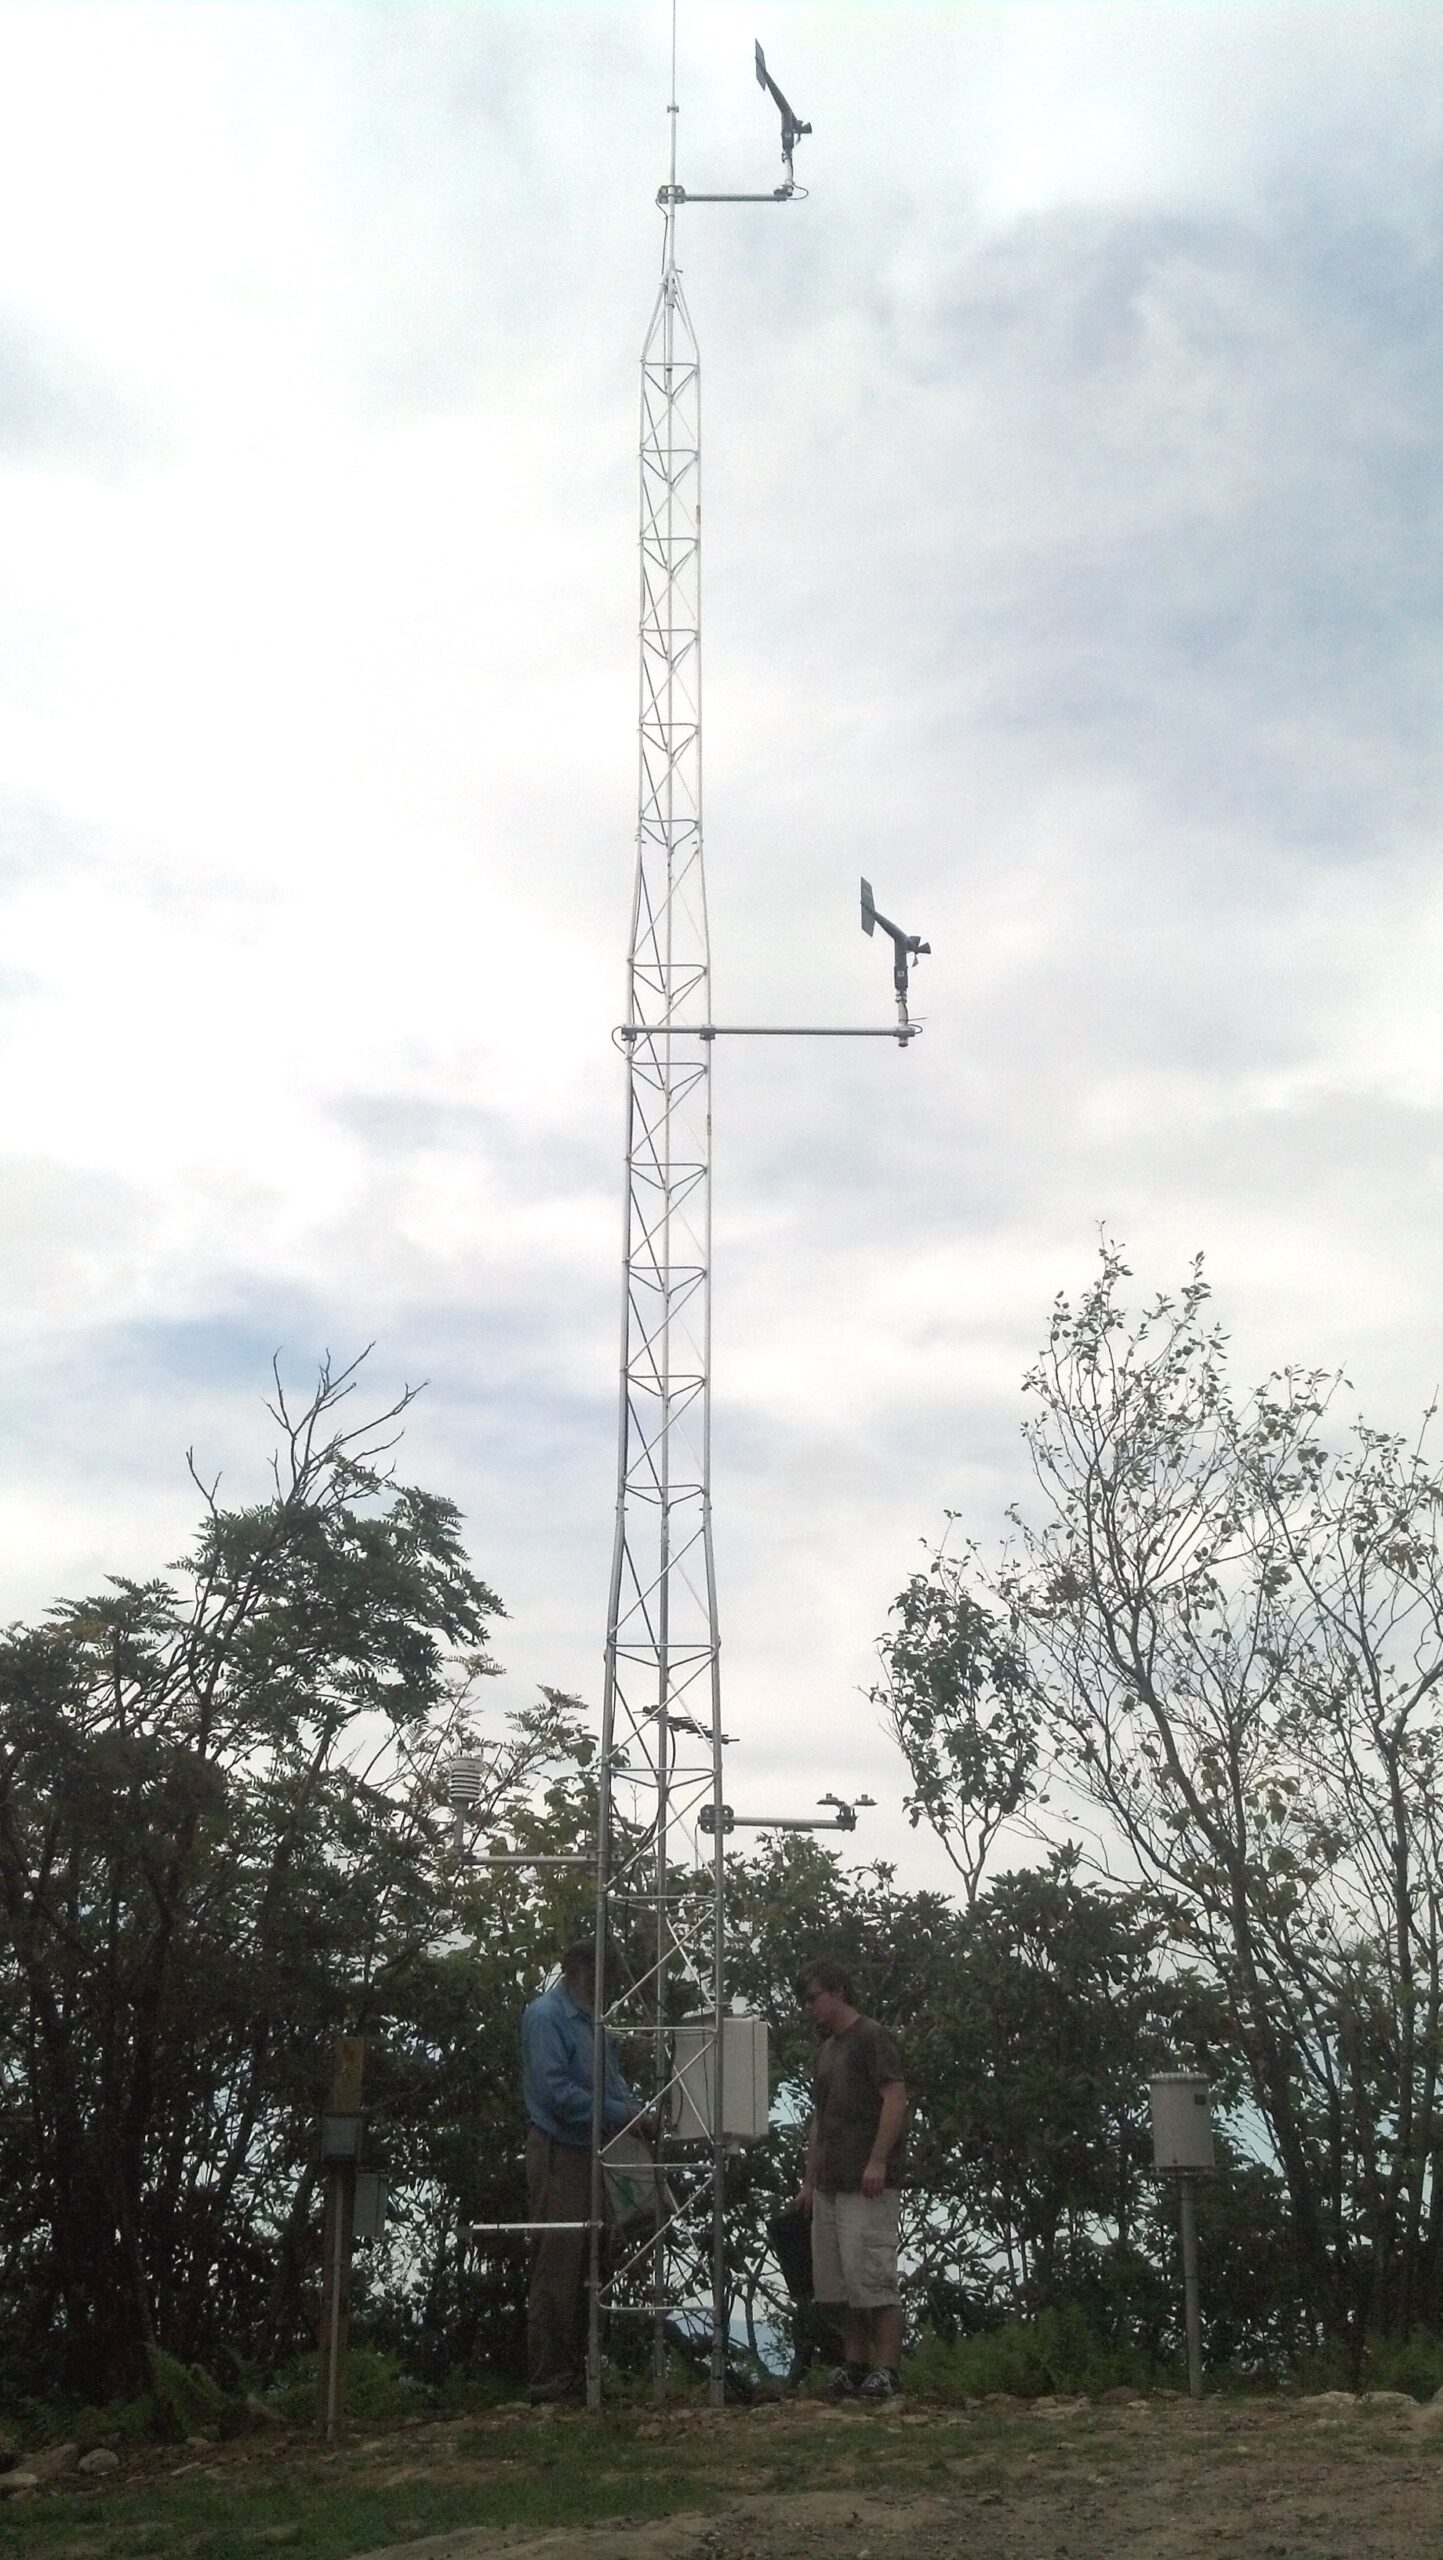
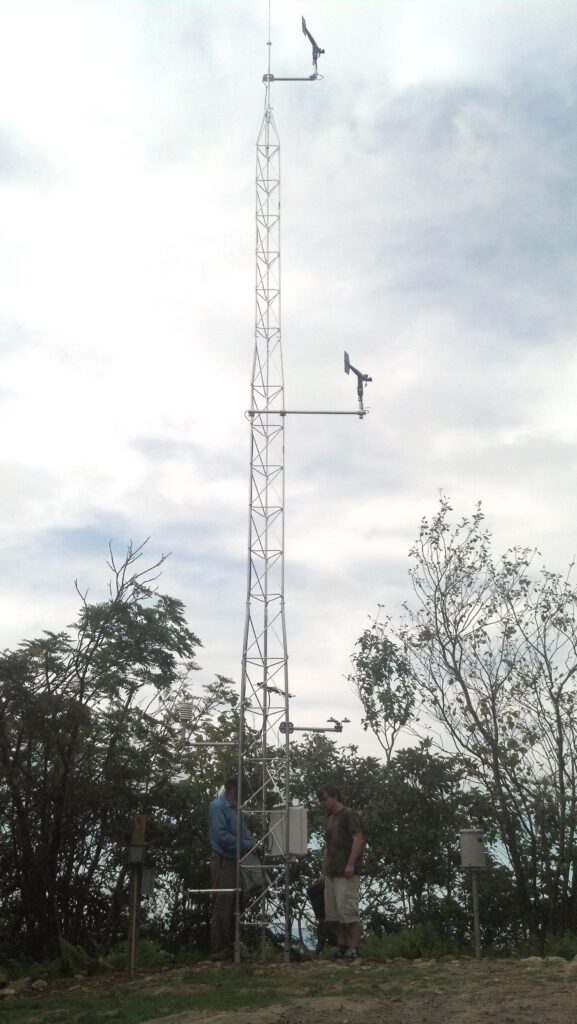
While working at the SCO, I have had the opportunity to perform field work on the NC ECONet weather stations and to learn more about the weather instruments. In fact, I was one of the students who helped install the new station located on Mt. Jefferson, NC.
Along with field work and product development, I am writing a manuscript about my research on predicting observed soil moisture using statistical modeling, which will be submitted to the Journal of Atmospheric and Oceanic Technology. The statistical model is in the process of being implemented as an additional quality control method for NC ECONet observed soil moisture data.
In addition to assisting with maintenance of weather stations, I also enjoy helping quality control the observed data, a process that assesses the accuracy of the data and lets ECONet technicians know if sensors are in need of re-calibration or replacement. This ensures that the best possible weather data is available for clients such as yourself!
- Categories:


