Climate Summary: 2012 By the Numbers
Now that all the numbers are in, we have sense as to how 2012 fits into our climate history for North Carolina. The statewide average annual precipitation of 46.2 inches ranked as the 32nd driest since 1895, and the average temperature of 60.35°F ranked as the 6th warmest since 1895.
Here are some other interesting statistics from 2012:
- 58.7°F: Statewide average temperature for March, making it the 2nd warmest March on record.
- 36 inches: Amount of snow reported in Newfound Gap after Hurricane Sandy.
- 105°F: Raleigh reached it’s all-time record high of 105°F on three separate days during the heatwave that stretched from June 30 to July 8 (it had previously only reached 105°F on three other days since 1948).
- 107°F: Highest temperatures recorded in NC in 2012 at both Hamlet (Richmond County) and Longwood (Brunswick County).
- 120.7 mph: Maximum wind gust reported at Grandfather Mountain on December 21, 2012. These hurricane-force winds were due to an intense winter storm, not a hurricane.
- 81.70 inches: Total precipitation reported at Highlands, NC in 2012, making it the wettest location in NC for the year. Highlands was still 6.15 inches below normal for the year.
- 21,331 acres: Land area burned by the so-called “Dad Fire”, which started when a prescribed burn got out of control on Father’s Day in the Croatan National Forest.
- 10.6%: The highest percentage of the state under moderate drought during summer 2012. Despite extreme temperatures, drought impacts in the summer were minimal.
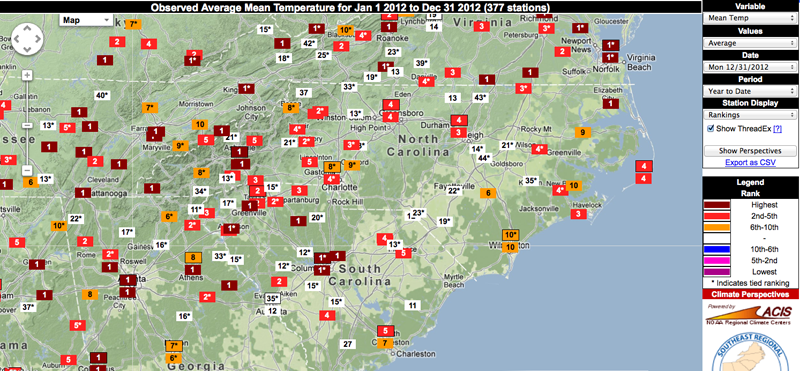
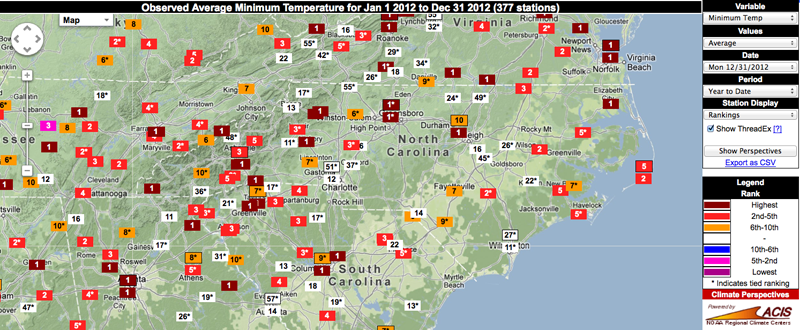
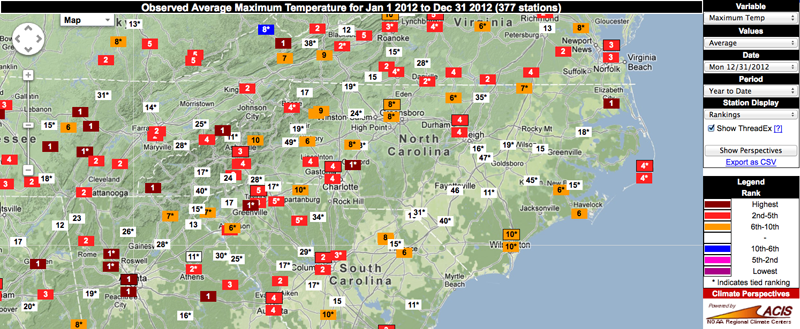
Digging a bit deeper, we see some interesting patterns across the state. Based on annual average temperature, many long-term reporting sites had top 5 warmest years for their individual records. The warmest year on record was observed in Murphy, Asheville, and Elizabeth City. Murphy and Elizabeth City also had annual maximum temperatures rank as warmest, and several stations reported annual minimum temperatures that ranked as warmest on record.
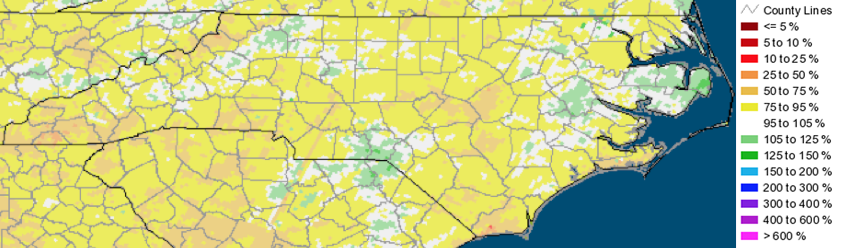
As hinted above, drought wasn’t much of a problem in the summer of 2012. However, both the early spring and late autumn were on the dry side. Overall, most of NC experienced annual precipitation totals for 2012 that were below normal.
- Categories:


