Thirty minutes into the most recent Olympic women’s soccer gold medal match between the United States and Brazil, officials recognized it was time for a break. However, it wasn’t for a foul or a penalty, and the only goal of the game wouldn’t be scored until the second half.
No, in this case, the precisely timed break was because of the heat, so both teams returned to the sidelines for a few minutes of rest and rehydration.
Not long after that, as high school football teams began their summer practices across North Carolina, coaches and training staff were routinely reminded about when they’re due for a timeout as well.
And since the 1950s, the US military has followed the same guidelines to know when their training exercises should go at ease for a few minutes of recovery.
So who is this Hydration Houdini, or what sort of weather wizardry, is advising athletes, soldiers, and other outdoor workers to take a break, from the pitches of Paris to the gridiron of Granville County to the training fields of Fort Bragg?
It’s none other than the Wet Bulb Globe Temperature, or WBGT — a mouthful of meteorological jargon that nonetheless offers our best indicator of outdoor heat stress.
It may come as a surprise to know that more than 1,200 people, on average, die in the US due to extreme heat related illnesses each year. And a new study that our office contributed to offers new insights into how this heat shapes up across North Carolina.

A WBGT Refresher
As we have detailed in the past, WBGT has been around for close to 70 years, but it has seen a rise in recent applications because of how well it models heat stress on the human body.
After all, how human bodies experience heat depends on more than just the air temperature. Indeed, that old southern saying that it’s not the heat, it’s the humidity holds true, as humidity, winds, and exposure to direct sunlight can each affect how hot it feels when working outdoors, and WBGT captures each of those factors in its three-part calculation.
It’s essentially a recipe combining these weather ingredients:
- Ten percent of the calculation is the ambient air temperature.
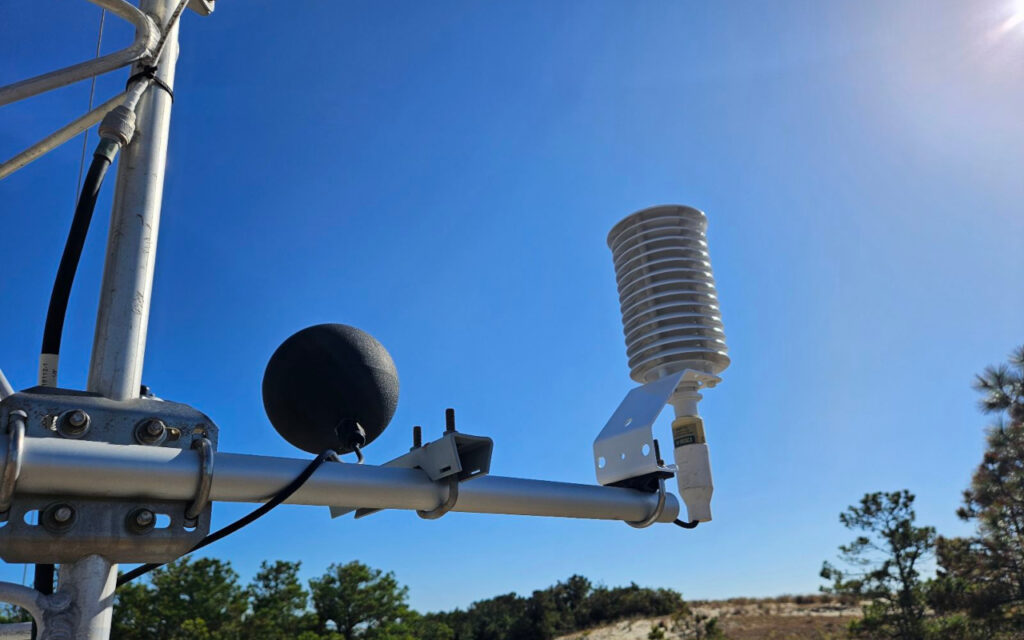
- Another 20 percent is the black globe temperature, so named because it can be measured using a black globe thermometer that fully absorbs incoming solar radiation and heats up accordingly.
- And 70% is the natural wet bulb temperature, which accounts for evaporative cooling on the skin that is limited by high humidity and increased by stronger winds.
All 45 of our ECONet stations statewide make these measurements every minute and report them to our office every five minutes.
At first glance, even the highest WBGT values may not seem that impressive, at least compared to common apparent temperature measurements such as the Heat Index, which is formulated as the ambient temperature plus some added discomfort factor.
Instead, WBGT values are lower than measured air temperatures due to the heavy weighting given to the natural wet bulb, which sits between the ambient (or “dry bulb”) temperature and the dew point.
A categorical color scale and corresponding rest break recommendations add context to those WBGT values. For instance, values above 86°F mean a High risk of heat stress, so 30-minute rest breaks are recommended after every 30 minutes of outdoor activity. That’s the guideline that FIFA used during the Olympics, and that the NCAA has implemented for its own soccer events.

Trends in North Carolina
WBGT has clearly found utility for real-time decision making, but it can also tell us something about historical heat stress and trends. That’s the focus of a recently released study from researchers at Embry-Riddle Aeronautical University, the North Carolina State Climate Office, the North Carolina Institute for Climate Studies (NCICS), and the White Sands Missile Range in New Mexico.
A key challenge in this study was estimating historical black globe temperatures at weather stations that have never been equipped with that instrumentation. Digging deeper into that part, our colleagues at NCICS have a news story explaining more about the methodology for evaluating various estimation algorithms.
Once a best estimate was identified by comparing against directly measured WBGT values from our ECONet and other weather stations, the research team calculated WBGT for 39 airport-based and military weather stations across the Southeast US between 1950 and 2023. This dataset included five stations in North Carolina, from coastal Wilmington to Charlotte, Greensboro, and Raleigh in the Piedmont to Asheville in the Mountains.
In some ways, the results weren’t too surprising. The frequency and intensity of high WBGT values has generally trended upward over time, in line with our own observations of climate change and its impacts on our state.

This study revealed some trends unique to North Carolina. For instance, near-coastal sites across the Southeast region generally had the fastest-increasing daytime WBGTs since 1950, but in North Carolina, it was two inland stations – Raleigh and Charlotte – with the greatest increases over time. In addition to background atmospheric warming, land use changes may be driving some of those increases in summertime heat stress.
The most extreme WBGT values – above the historical 90th percentile – have also become more common over time. Out of 39 stations in the region, 38 showed an increasing trend in the occurrence of these extreme values.
Raleigh again showed the greatest changes in the state, adding roughly two more days per decade with mean WBGT values above the 90th percentile. That wasn’t far off from the greatest increases in the region, all found within the Sunshine State in Daytona Beach, Miami, and Tampa.
Another interesting finding was that heat stress at night has increased faster than in the afternoon all across the region. This was particularly pronounced in Asheville, where the nighttime WBGT values have trended upward by more than half a degree per decade. And most recent years in Asheville have had more than 15 nights above the historical 90th percentile – a significant increase from what we had experienced in the past.
High nighttime WBGT values make it more difficult for people, animals, and plants to recover from daytime heat. That’s a sign that the summer climate of our typically cooler western region is quickly catching up to the rest of the state.

Recent High Heat
While this study ran through 2023, the summers of 2024 and 2025 have offered their own examples of high WBGT values, particularly during our heat wave this June.
Emphasizing the role that humidity plays in heat stress, and supporting the study’s region-wide findings about the increasing risk of heat stress in coastal areas, our ECONet stations along the coastline have had the most extreme WBGT values in the state so far this summer.
Our station in Aurora along the Pamlico River set a new record high WBGT of 95.3°F on June 24. The following day, our Rocky Mount station broke the network-wide WBGT record with a maximum value of 95.6°F at noon.
Over the entire month of June, our station at Jockey’s Ridge State Park had 47 total hours in the Extreme range. For anybody hiking along the sand dunes or strolling down the beach in those conditions, heat stress could set in within 15 minutes, and 45 minutes of break time is recommended each hour.

At the southern coast, our station on Bald Head Island reported 254 hours last summer and 114 hours this June in the High range, which can cause heat stress after only 20 minutes of outdoor activity.
During our most intense heat spells, stress has been hard to escape even overnight. Last year from July 13 to 17, our Bald Head Island station recorded 92 consecutive hours – or almost four full days – with WBGT values at the Elevated level or greater, representing ongoing stress at all hours of the day.
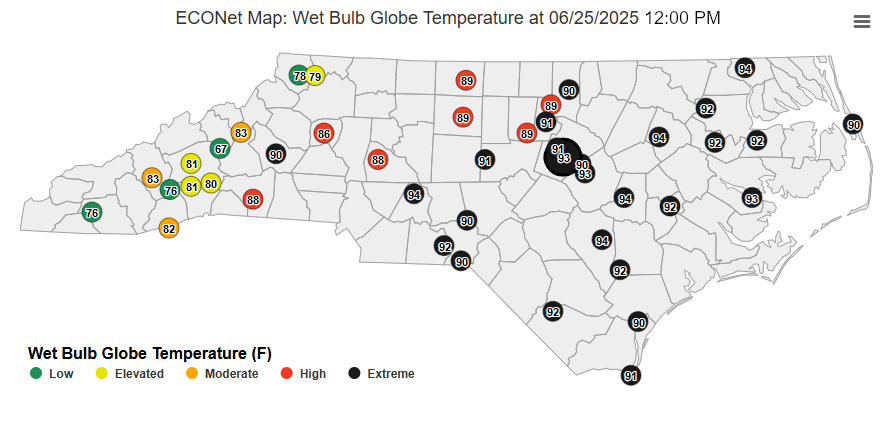
Inland areas have also endured some Extreme conditions in recent years. Last summer, 32 of our ECONet stations had at least one hour with WBGT in the Extreme category. And 26 of 45 stations spanning as far west as Morganton had Extreme heat as assessed by the WBGT on June 25 of this year.
During that sweltering afternoon, our station in Fletcher became our first ever mountain site to hit the Extreme WBGT category with a maximum value of 91.2°F at 4 pm. That was one of eight record-high WBGTs at our mountain ECONet stations so far this summer.
Heat Monitoring Continues
The summer of 2025 is barely halfway finished, but it has already brought extreme heat across the state. To help us inform and prepare people on those hot days, we’re working on a number of projects surrounding heat and heat stress here at the State Climate Office.
Several years ago, we conducted our first Urban Heat Mapping Campaign in Raleigh and Durham, and the City of Charlotte completed their own mapping study last July. That data helped us better understand where the hottest local temperatures occur, particularly in paved and unshaded areas, and how much hotter they can get on sunny summer afternoons.
To visualize real-time conditions, our WBGT tool offers current and historical WBGT values for all 45 of our ECONet stations, which are equipped with black globe thermometers. Clicking on a station in that tool will show a five-day history of its hourly WBGT conditions, color-coded by category so the hottest hours stand out.
And as a continuation of the project with Embry-Riddle and NCICS, we’re working on a new Heat Monitor tool that will show heat risk levels using a unique climate perspective, such highlighting when forecasted WBGT values across the region exceed the historical 90th, 95th, and 99th percentiles.
Ultimately, we aim to provide North Carolinians with tools to stay safe and provide context so that we can better understand how heat affects us each day, and how that risk is changing over time.