Urban Heat Island Temperature Mapping Campaign
Raleigh and Durham – 2021
A community project to map heat islands in Raleigh and Durham!
About The Project
In 2021, Raleigh and Durham were two of the 15 locations selected to participate in the NIHHIS-CAPA HeatWatch Campaign.
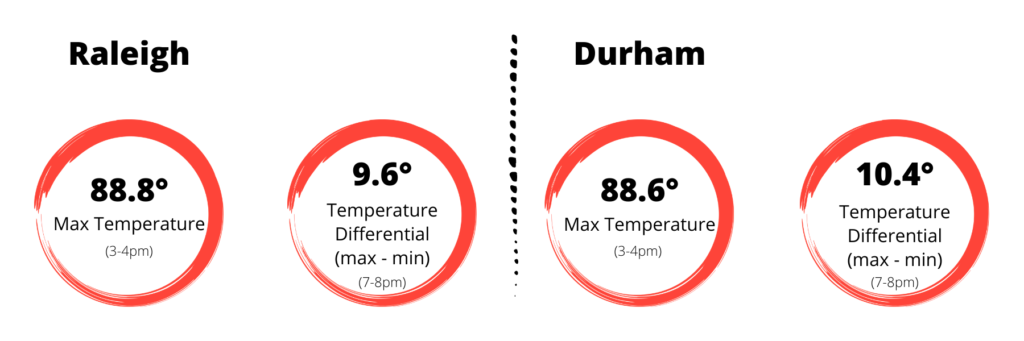
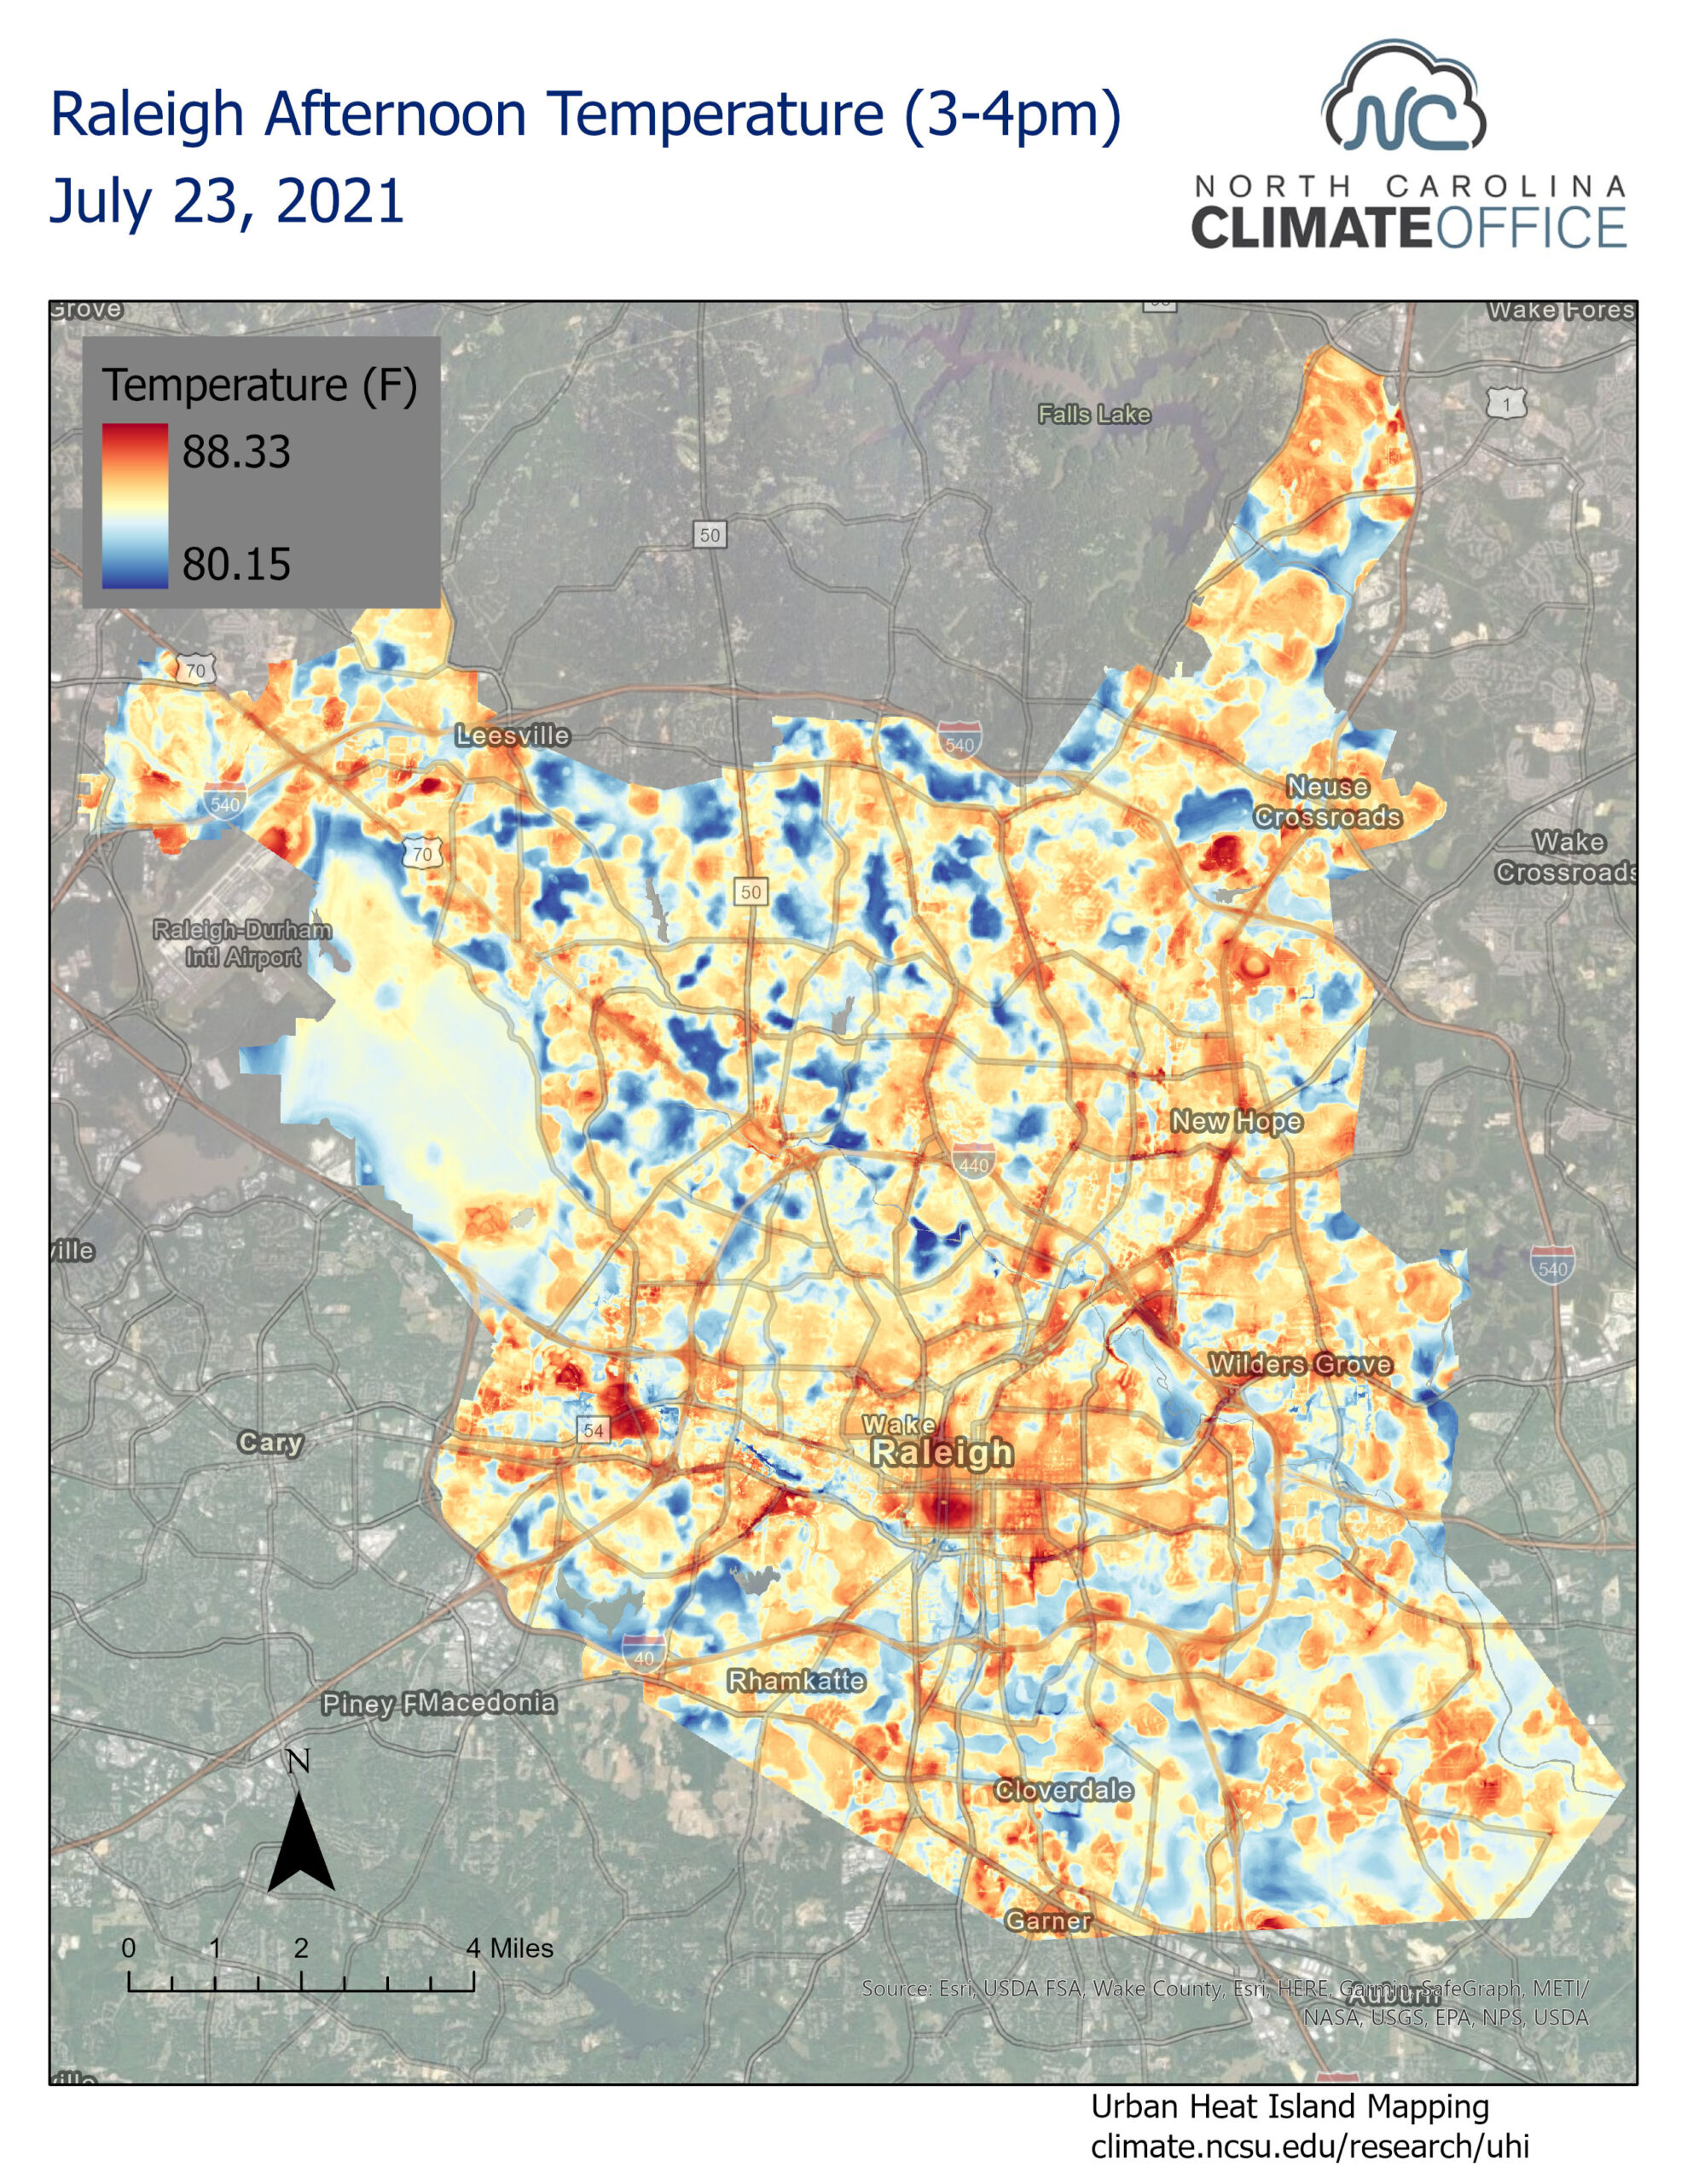
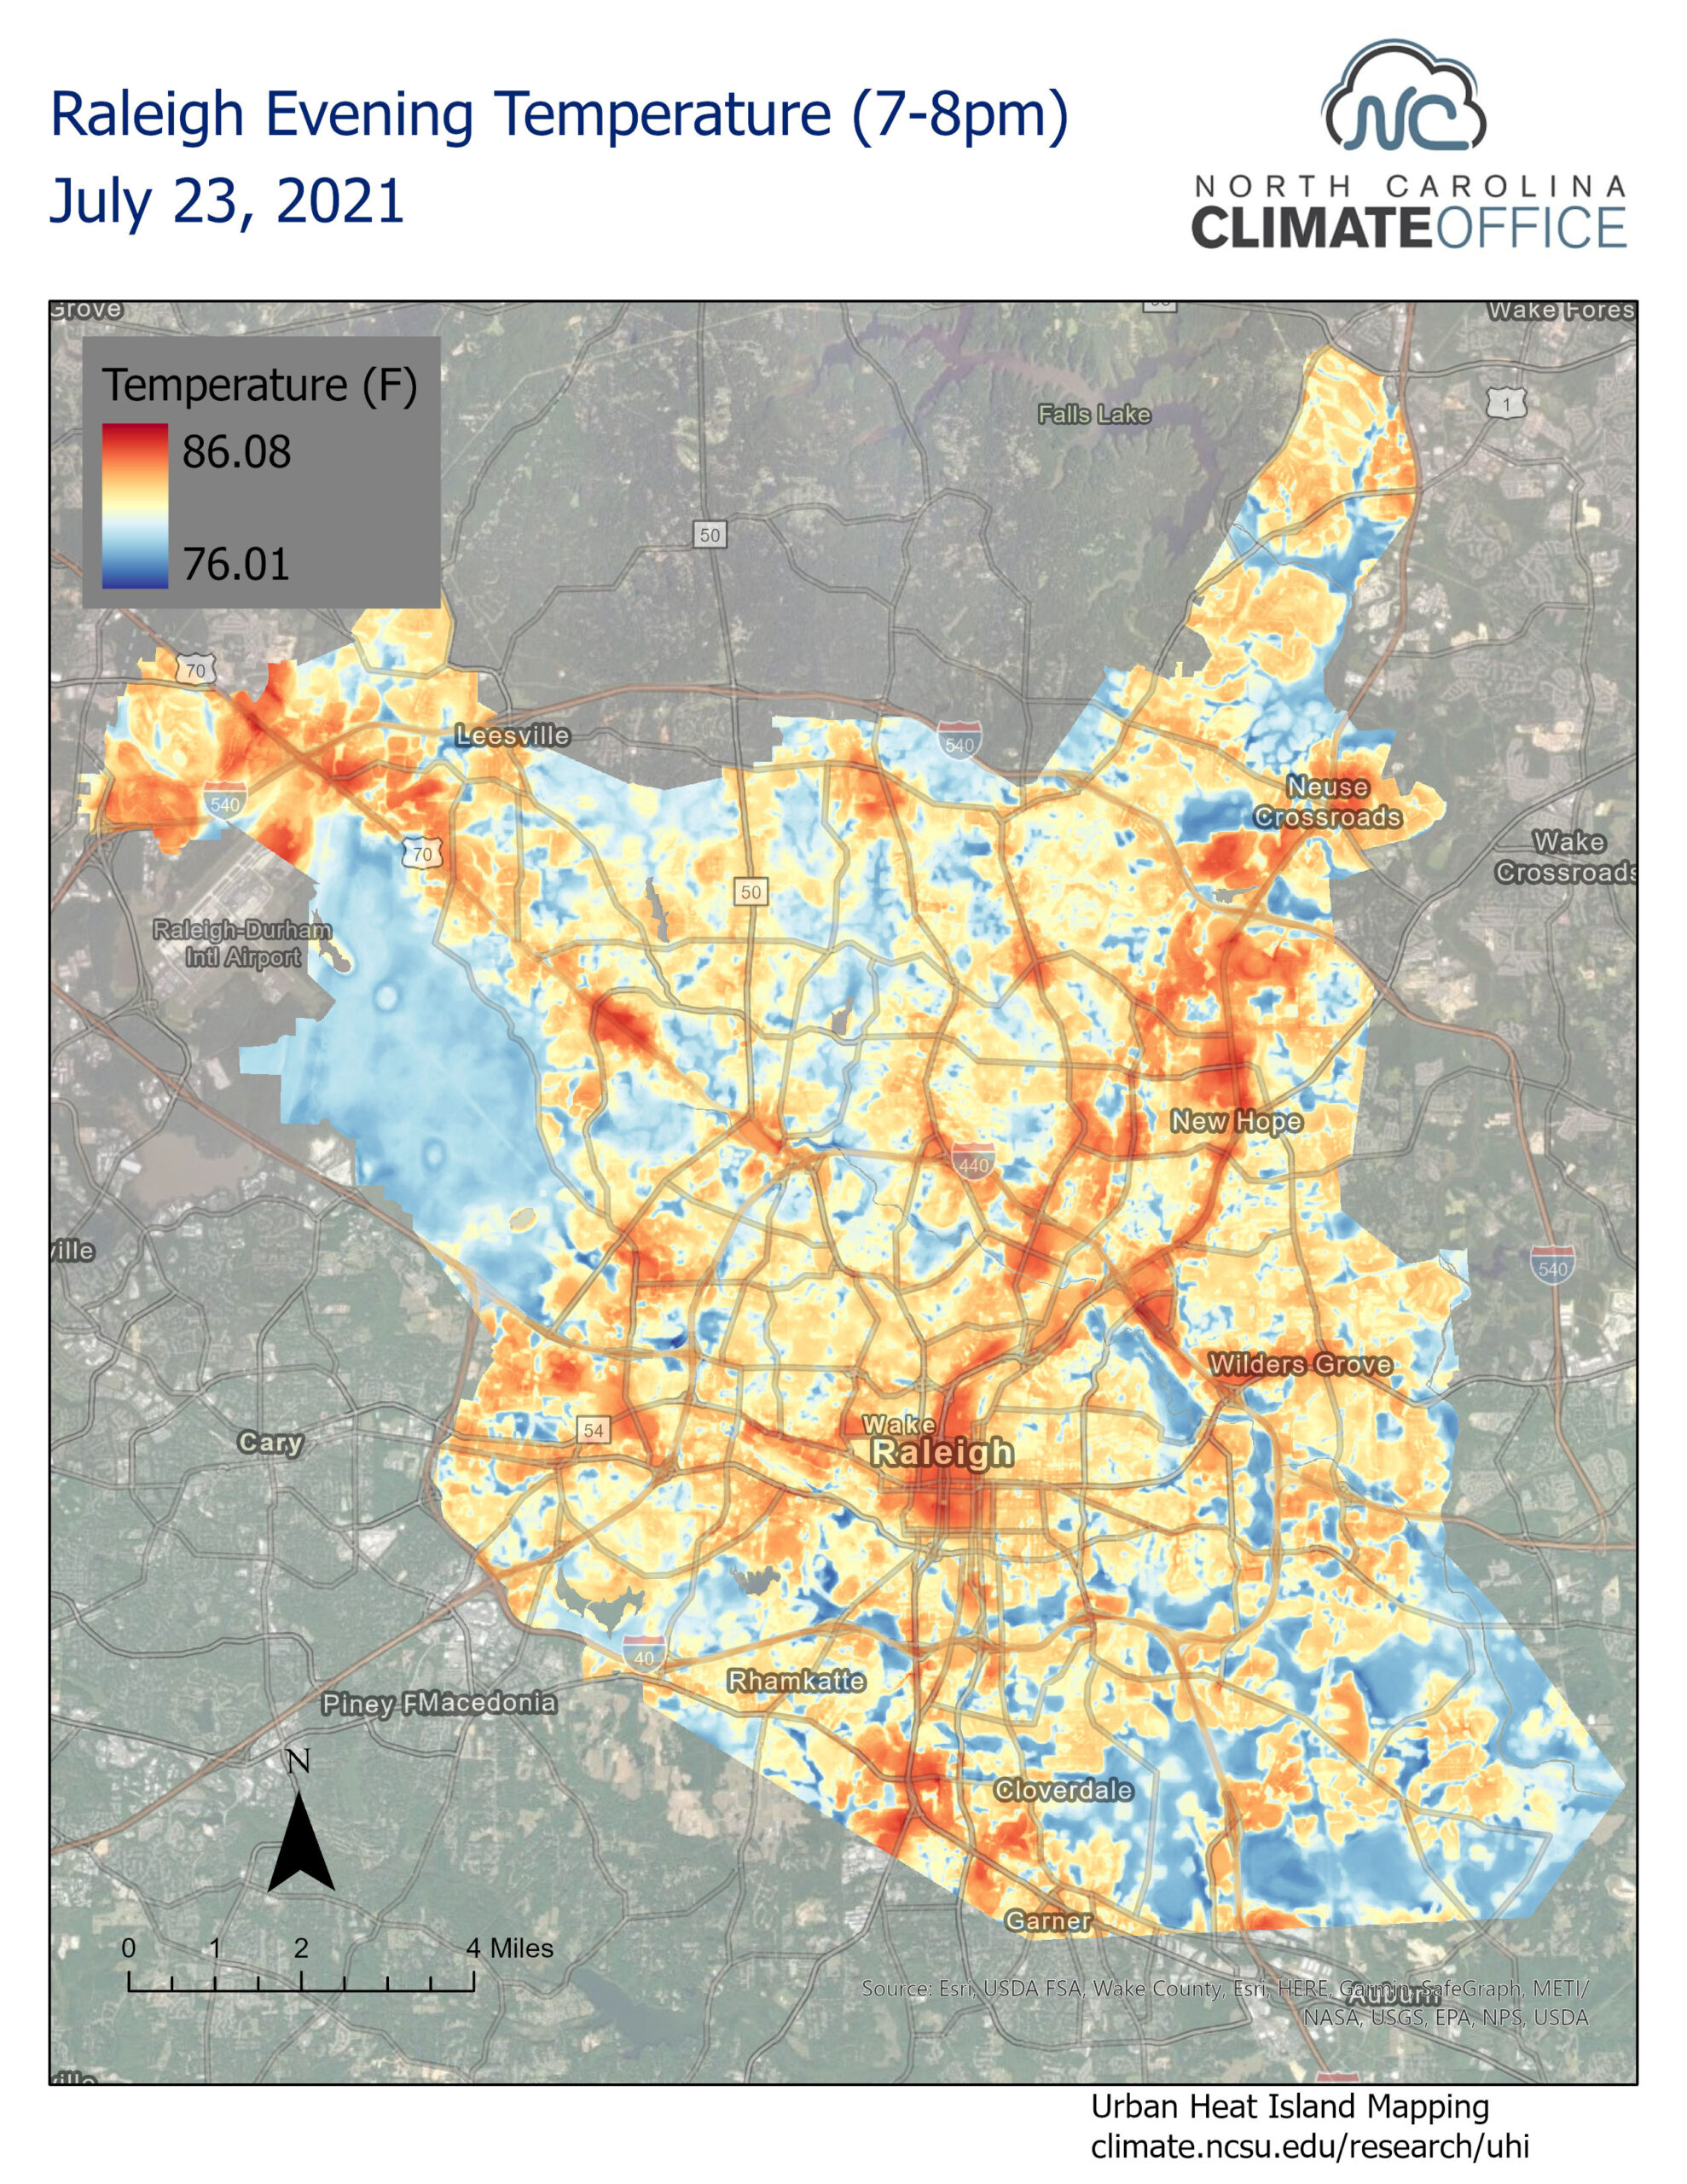
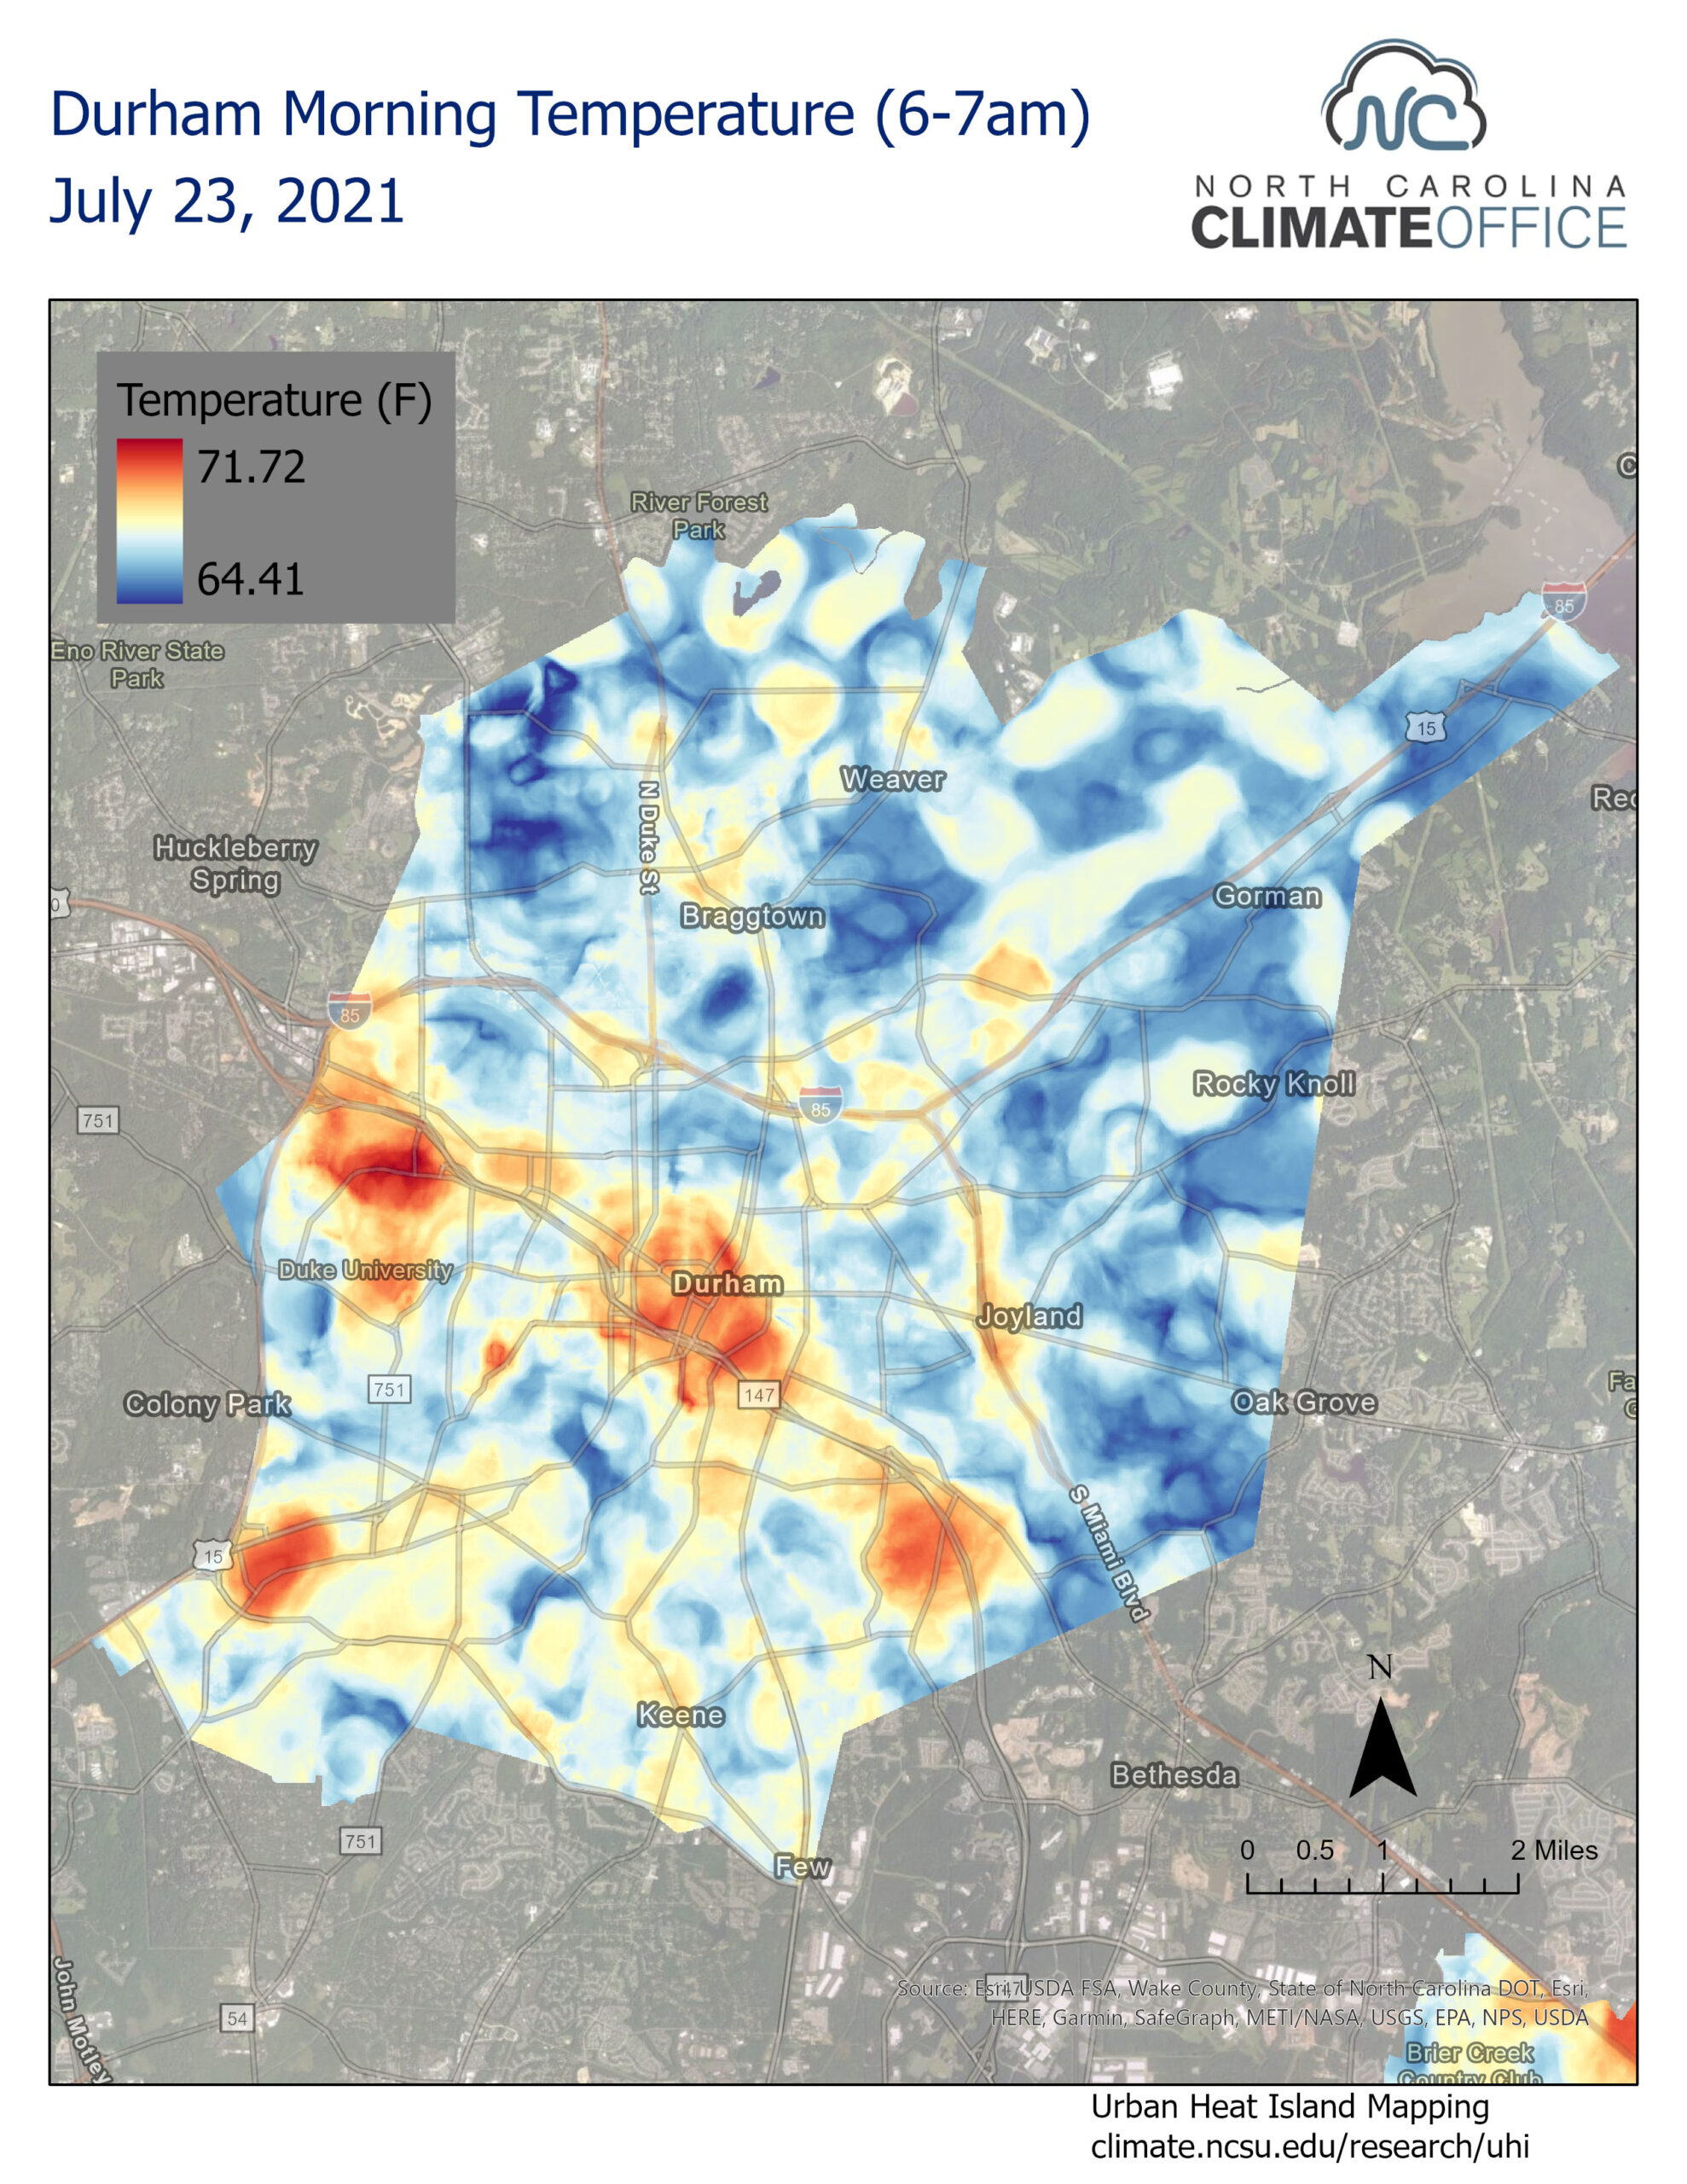
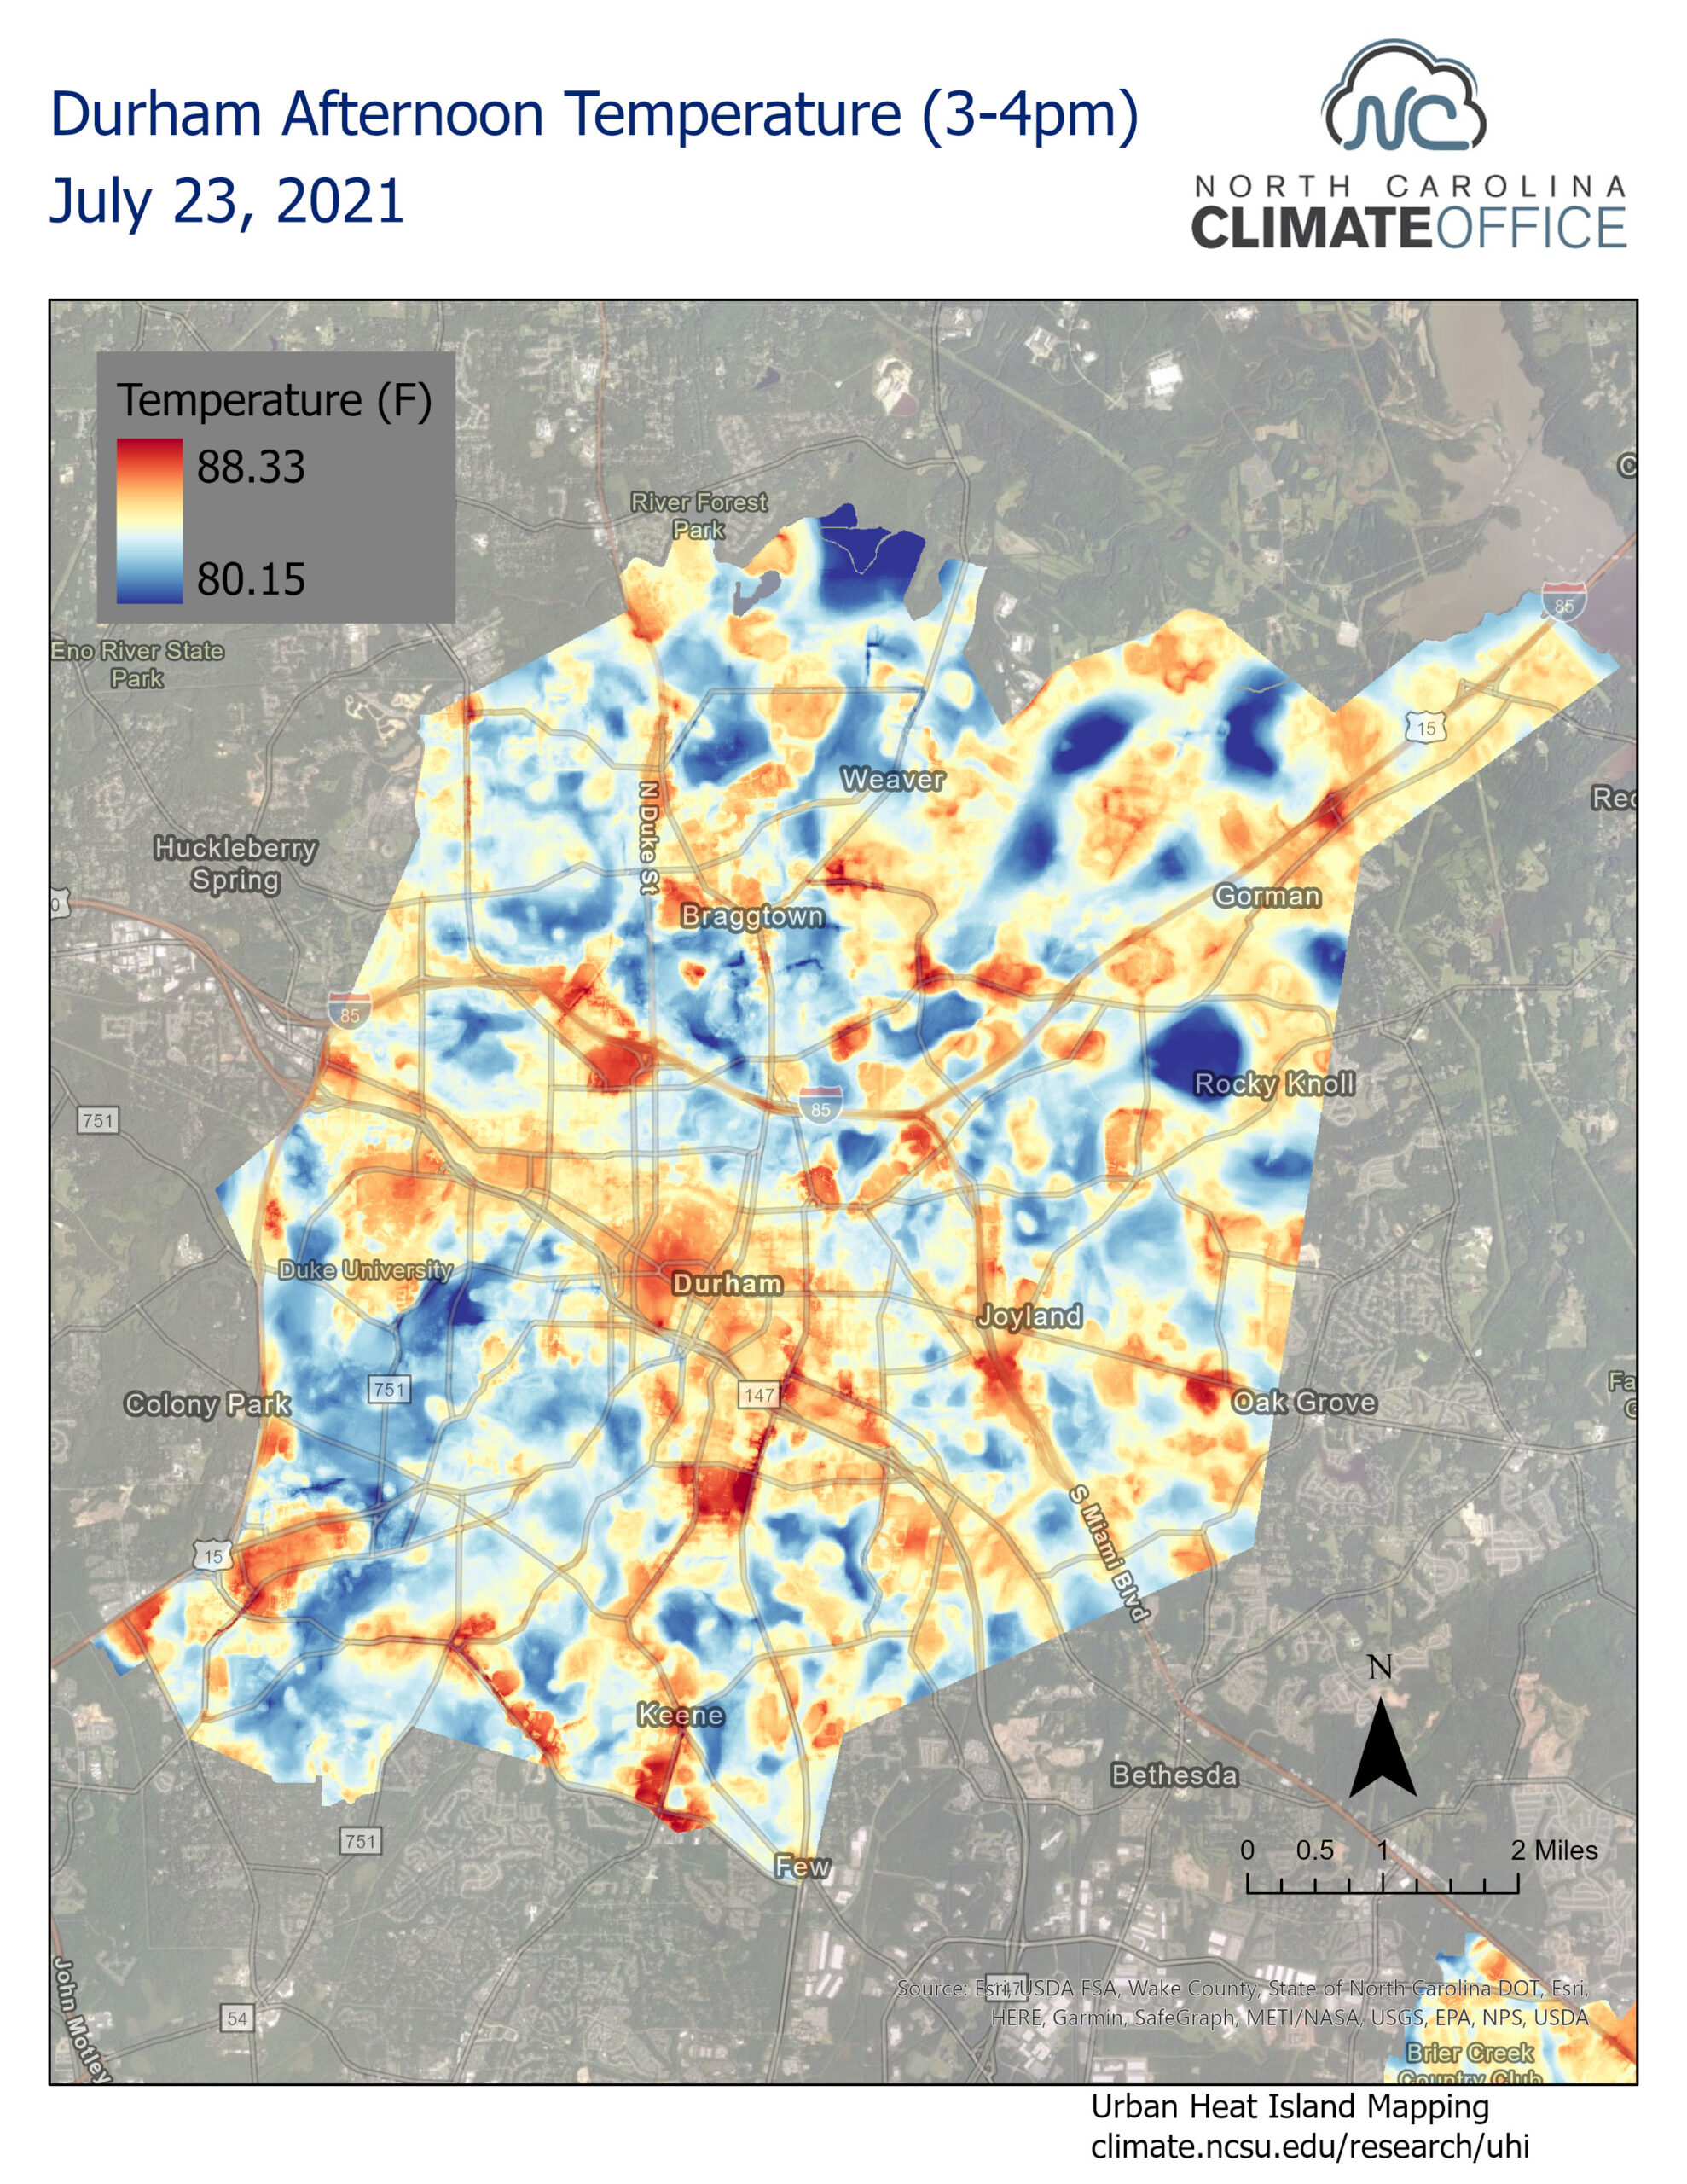
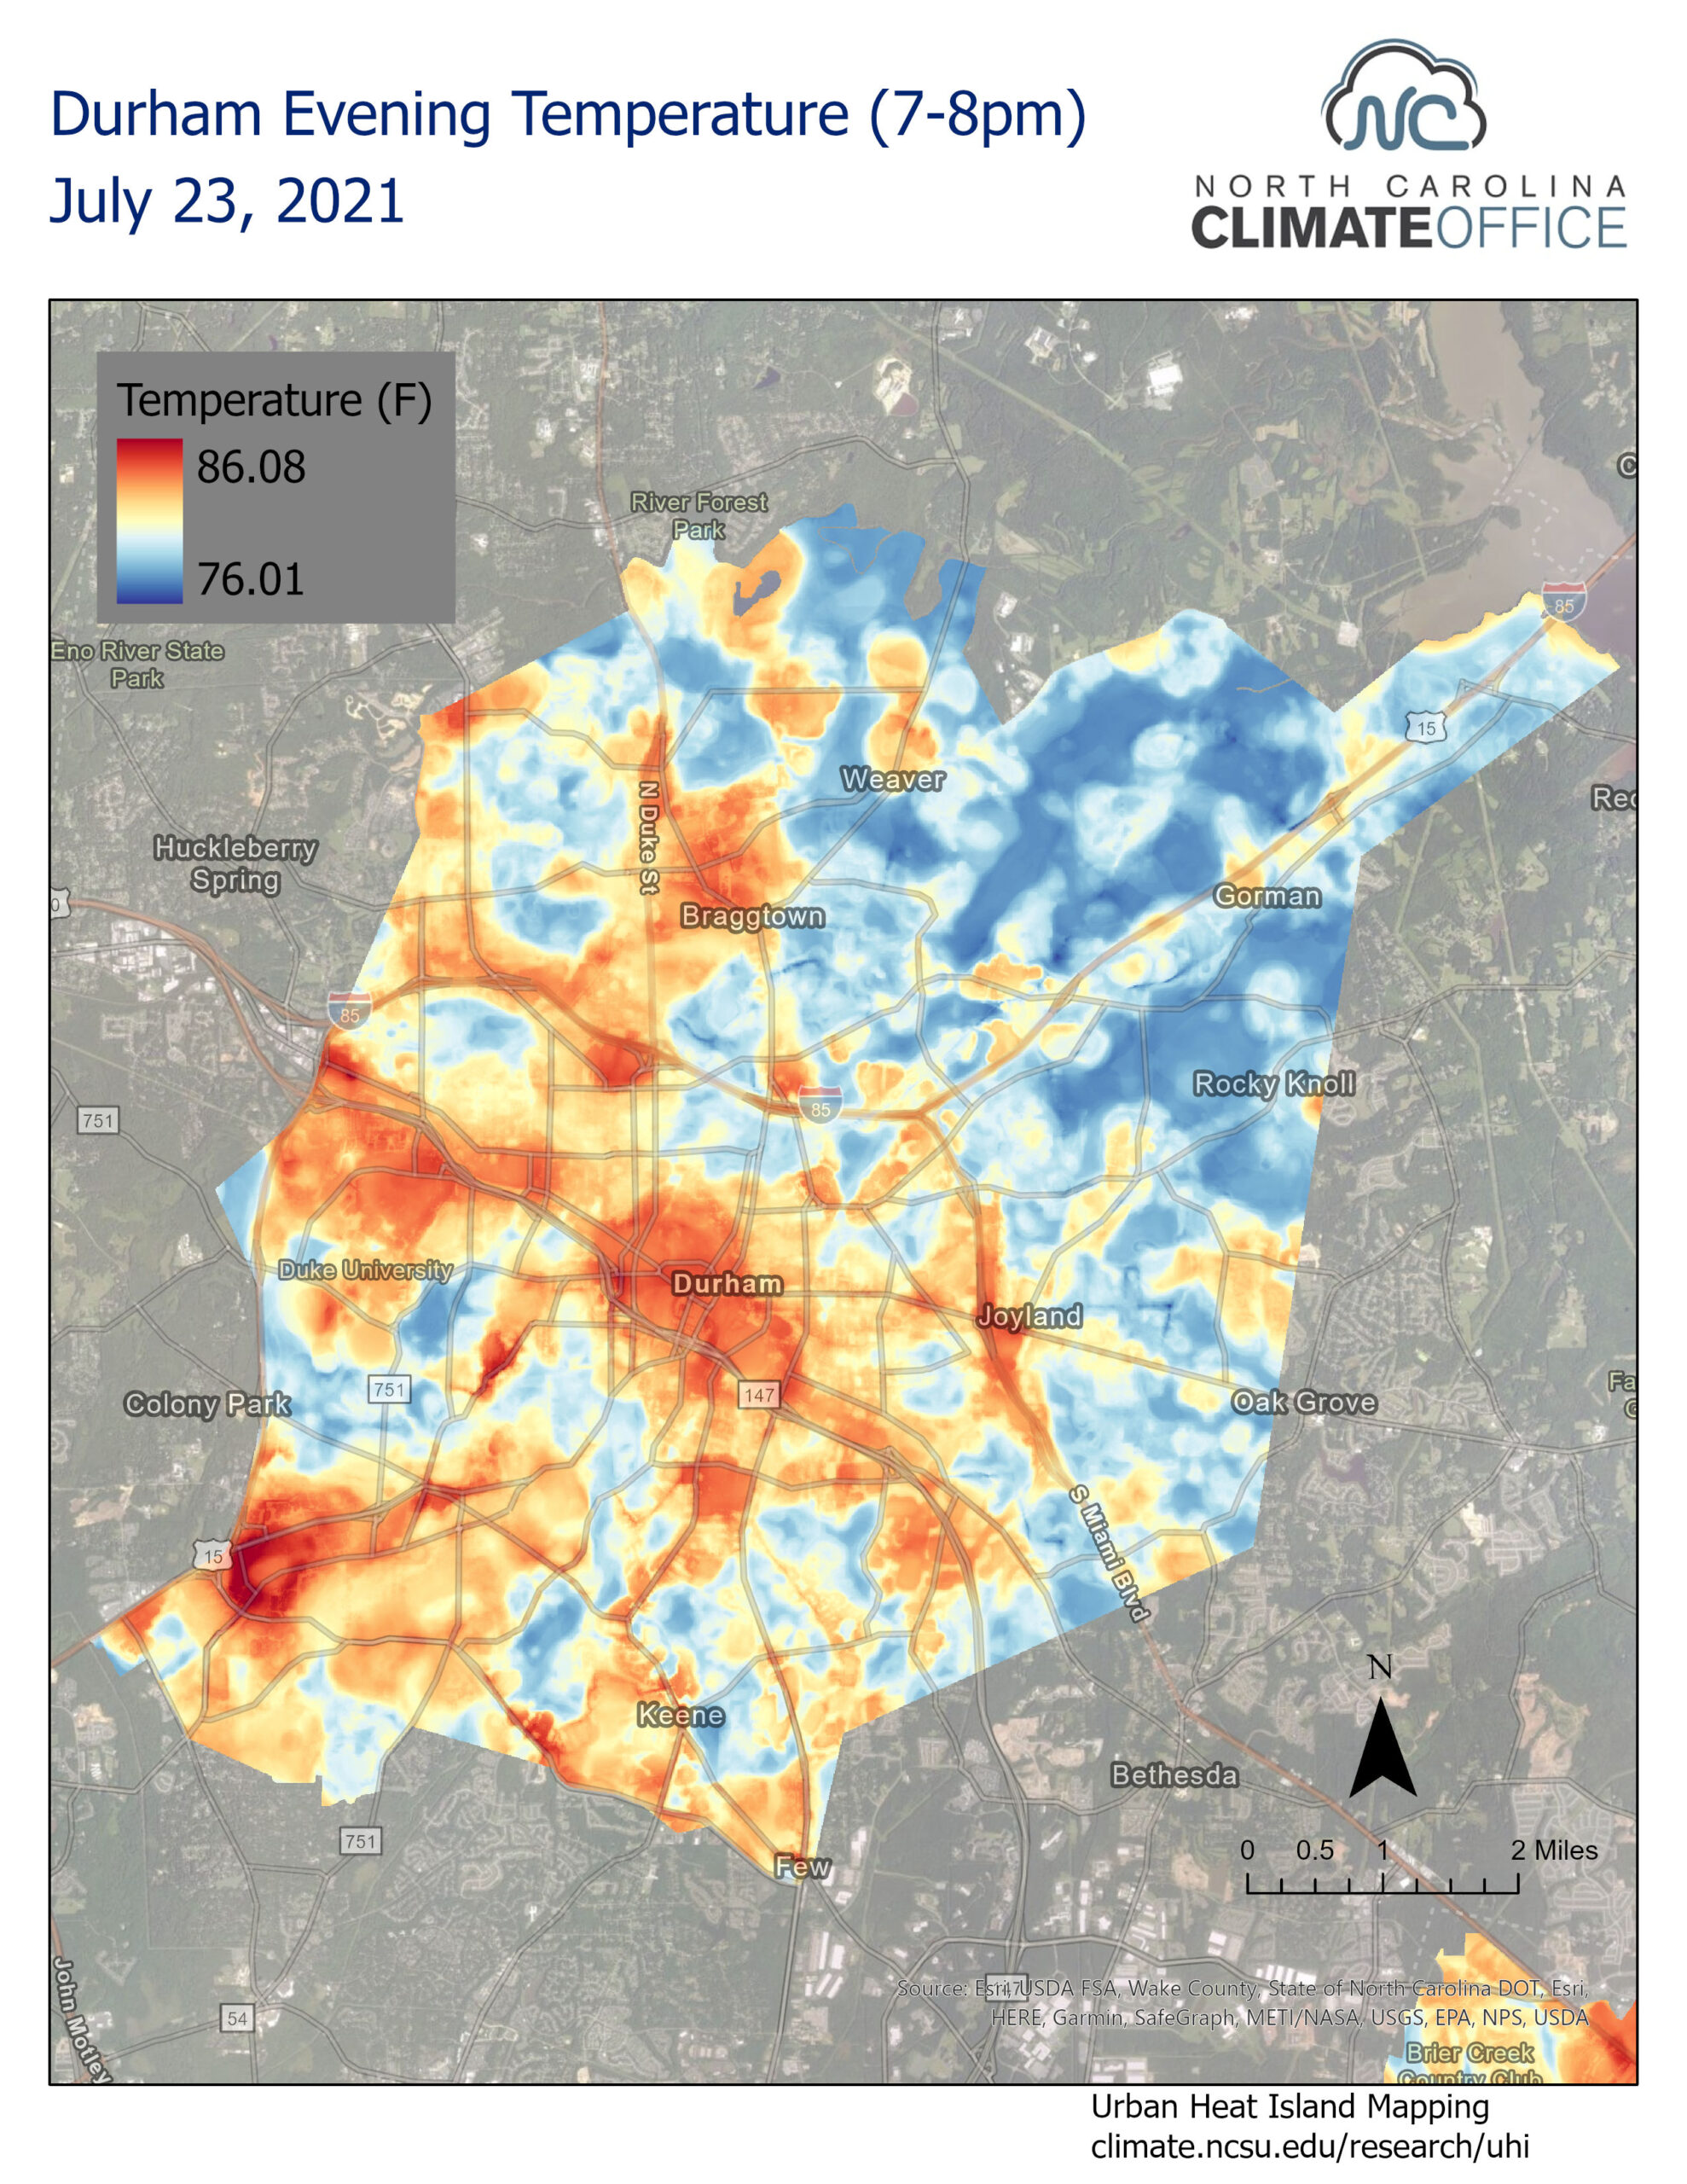
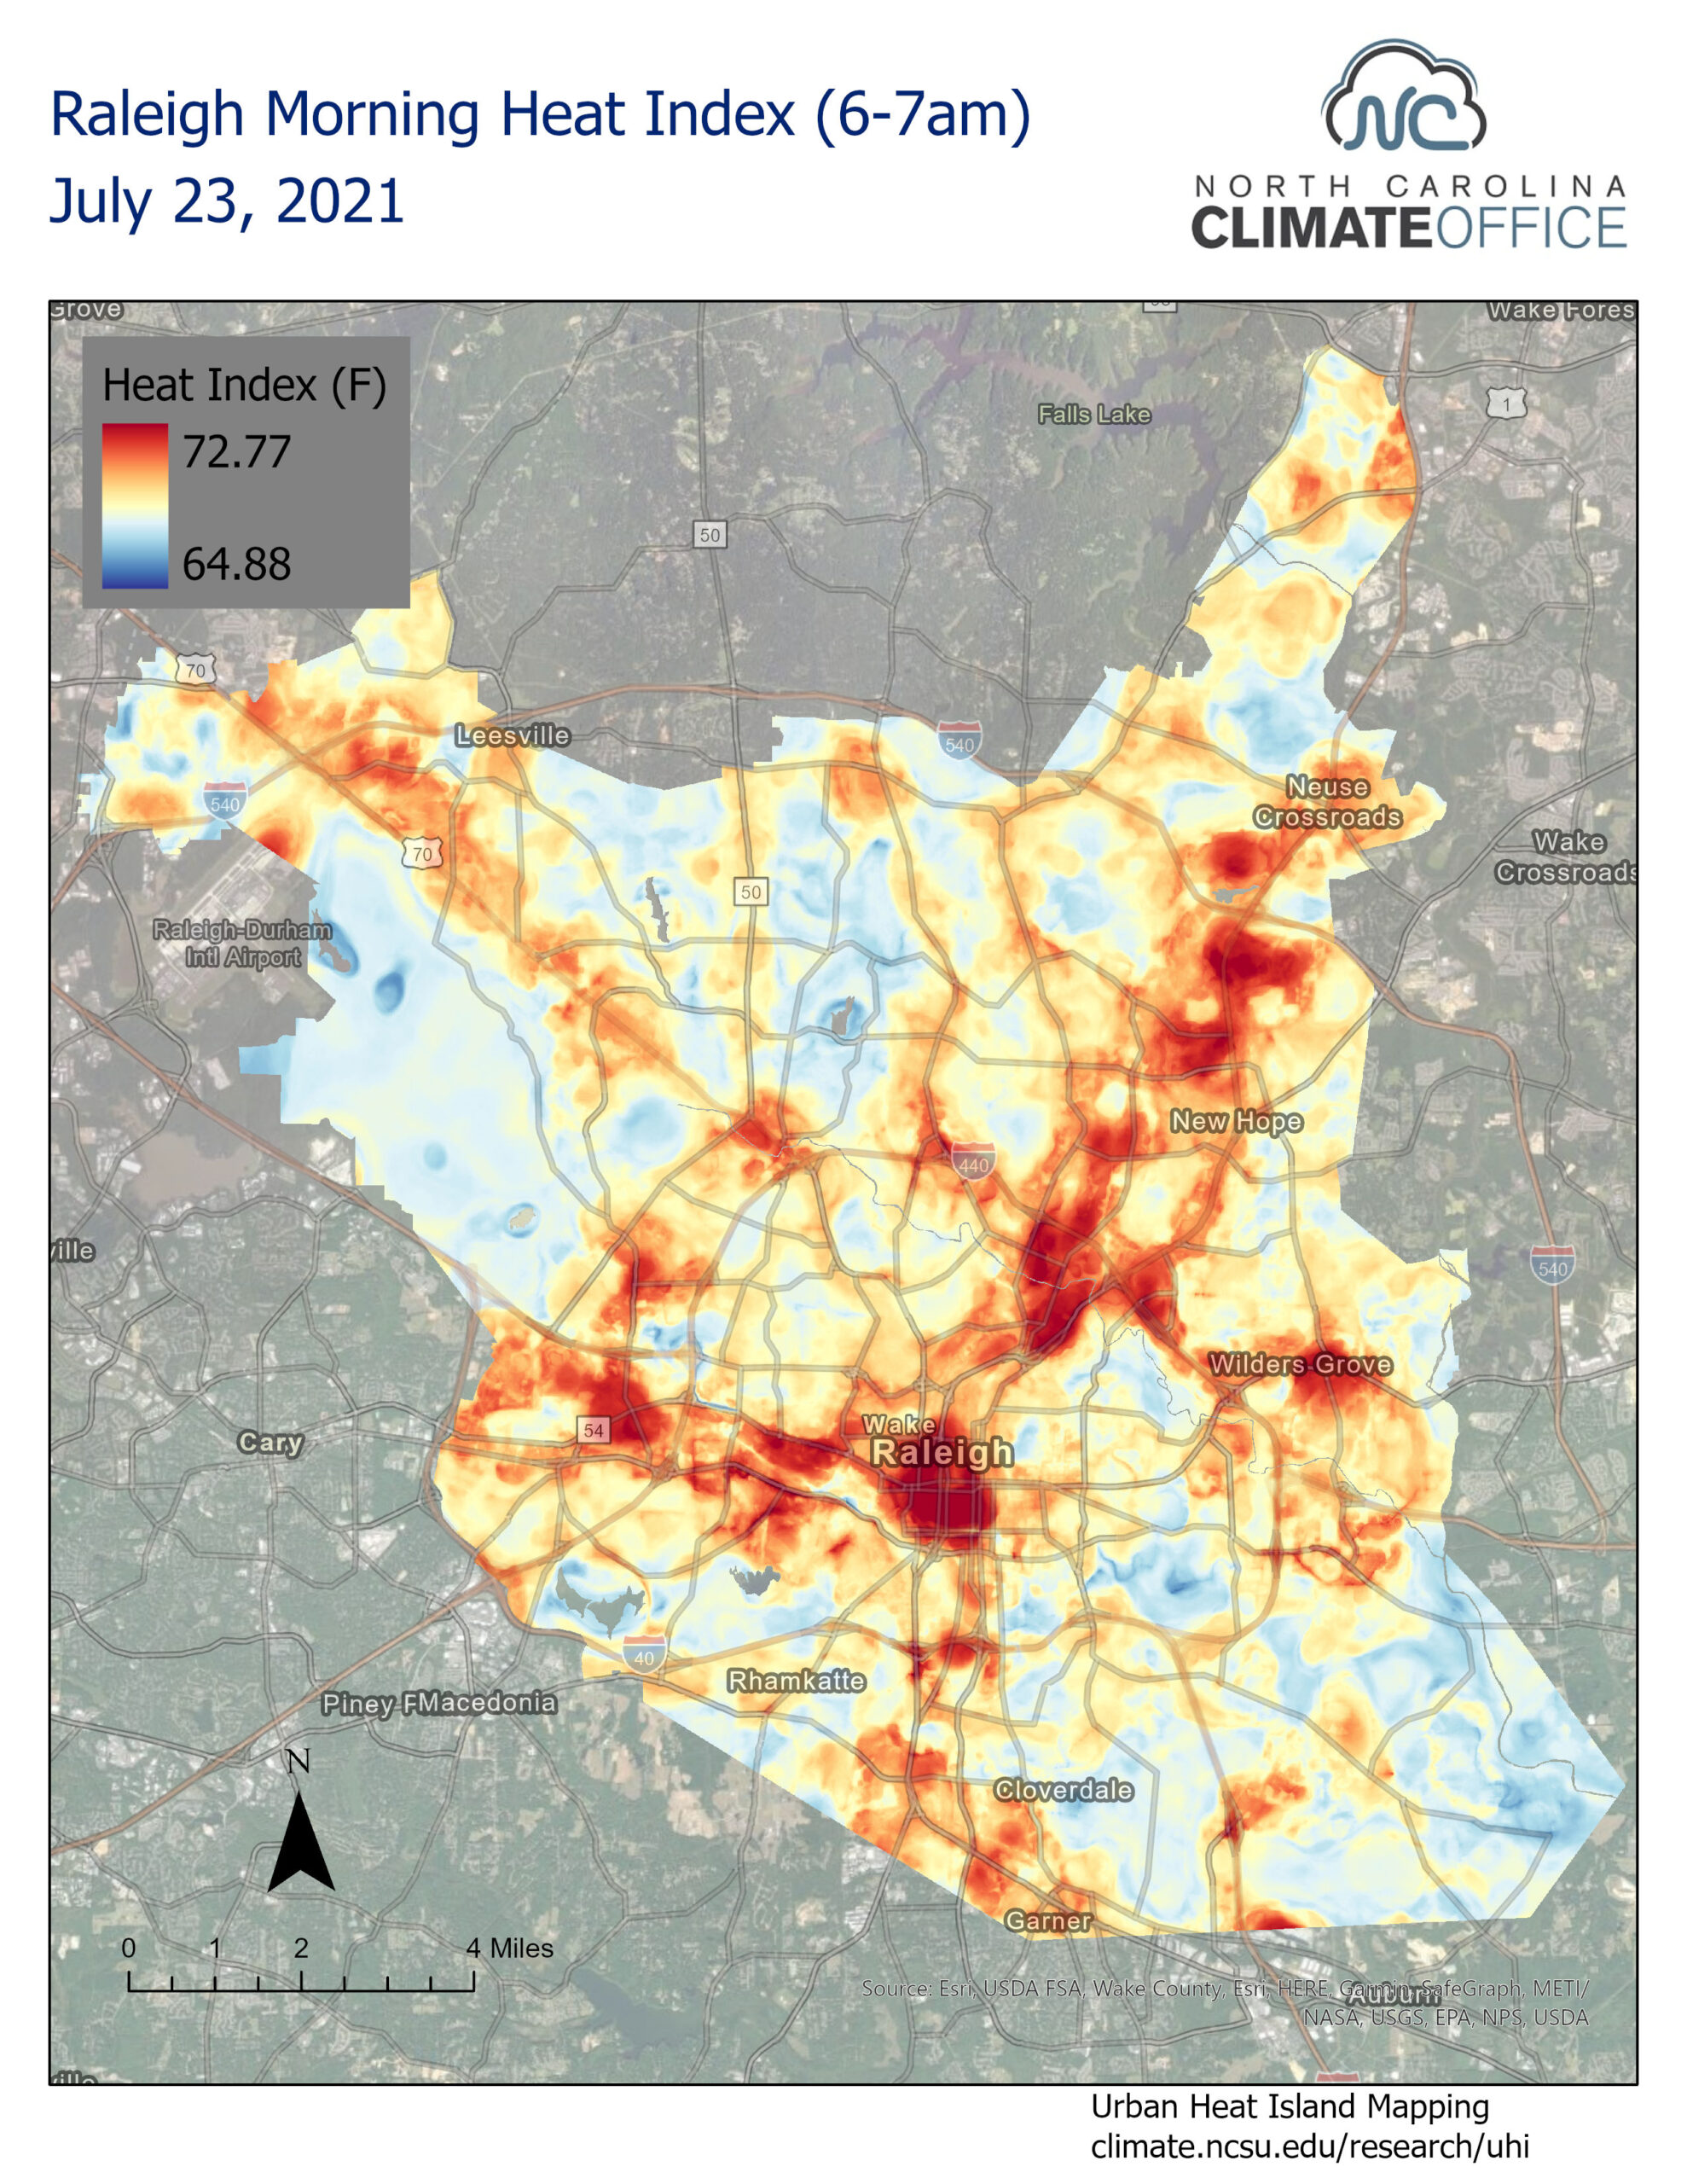
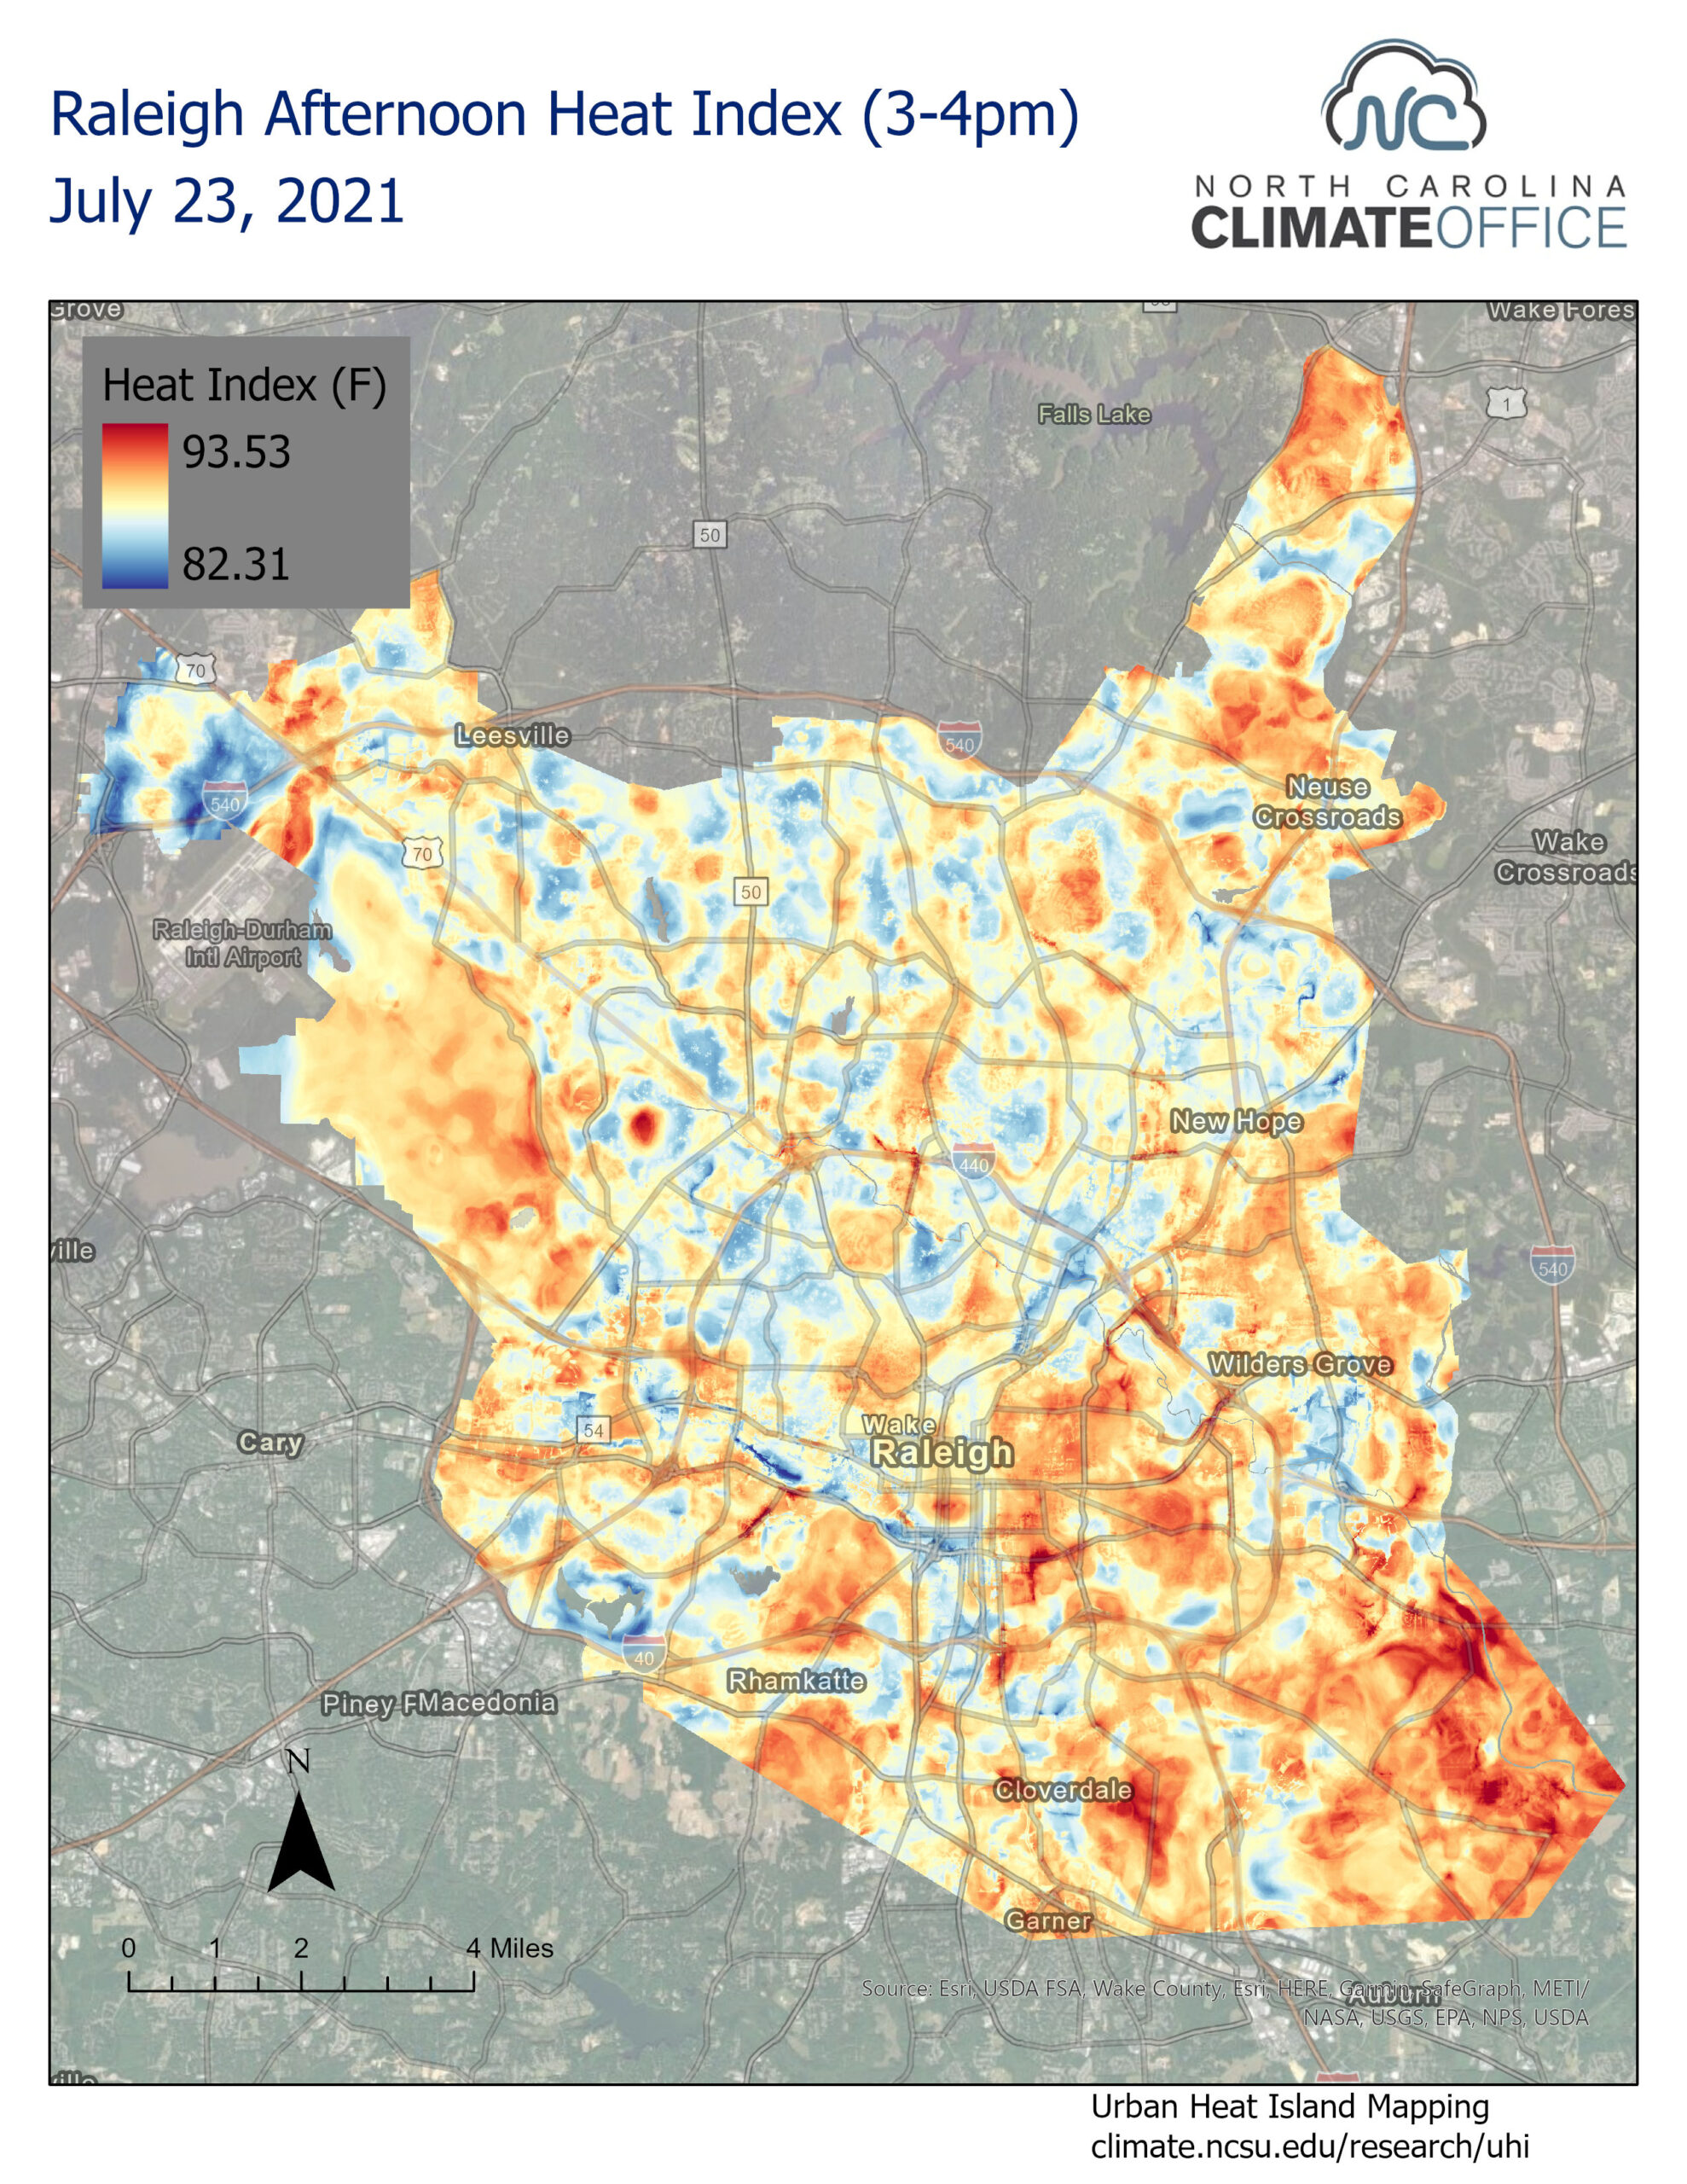
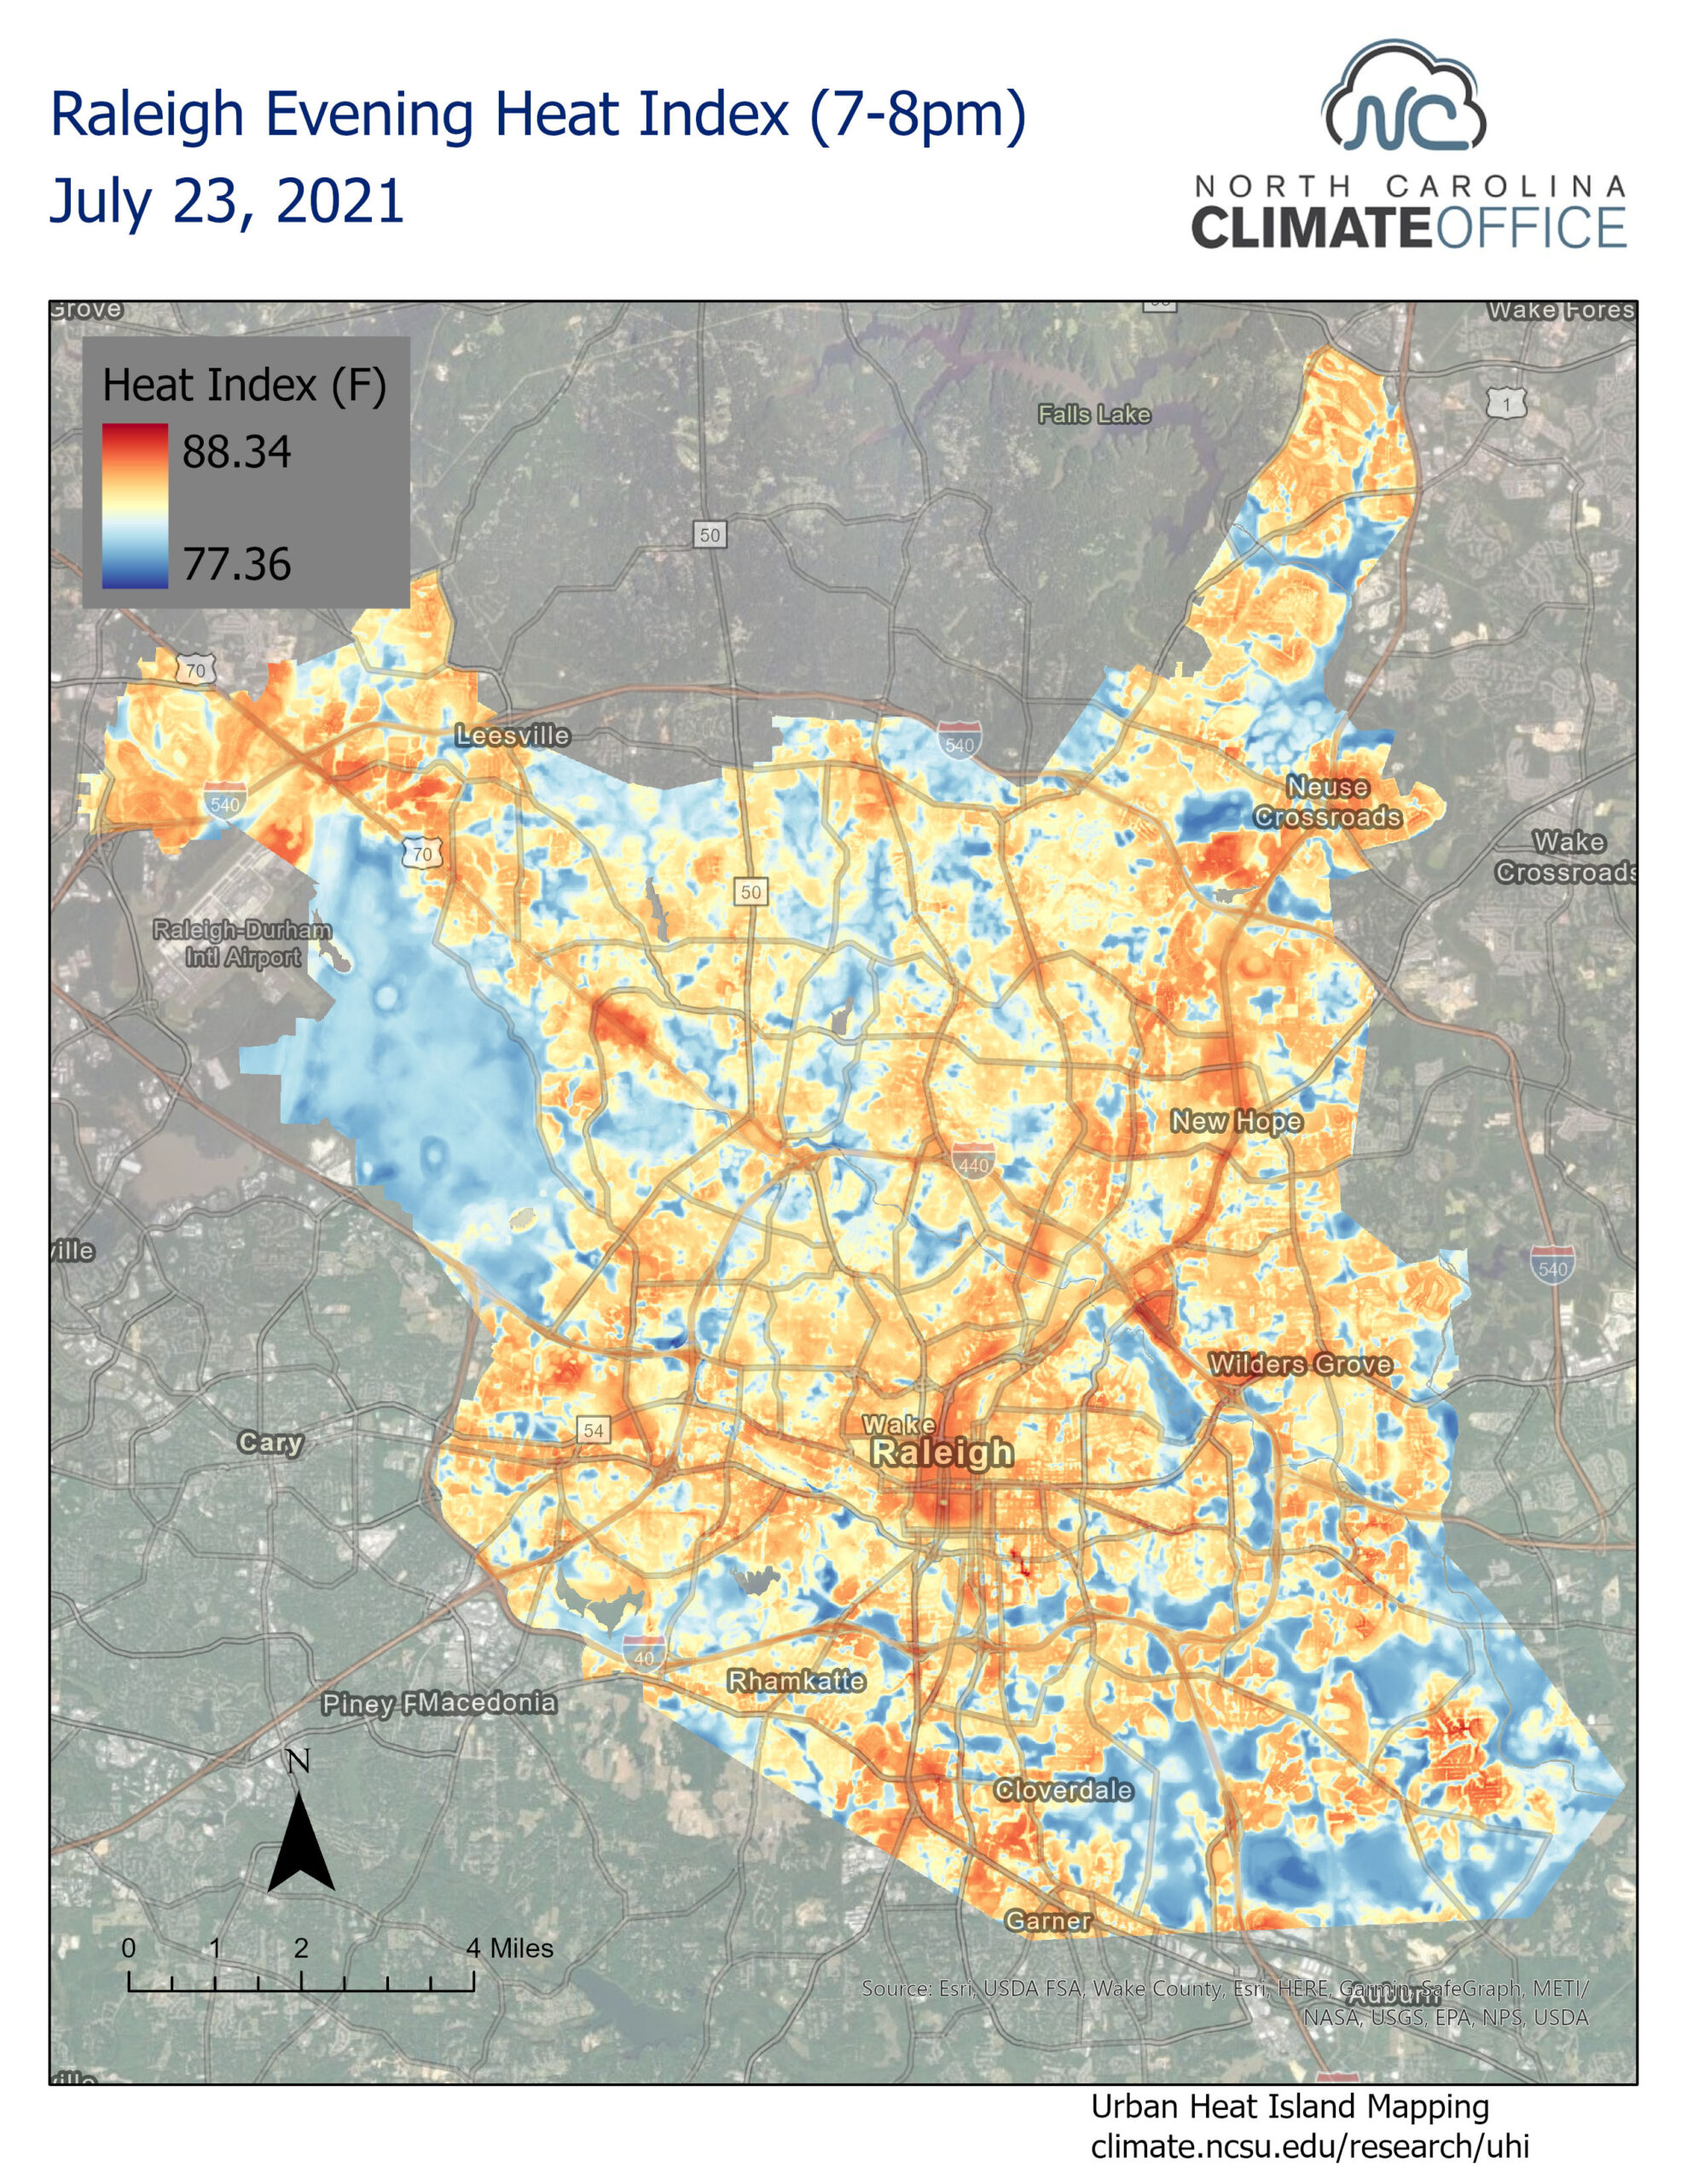
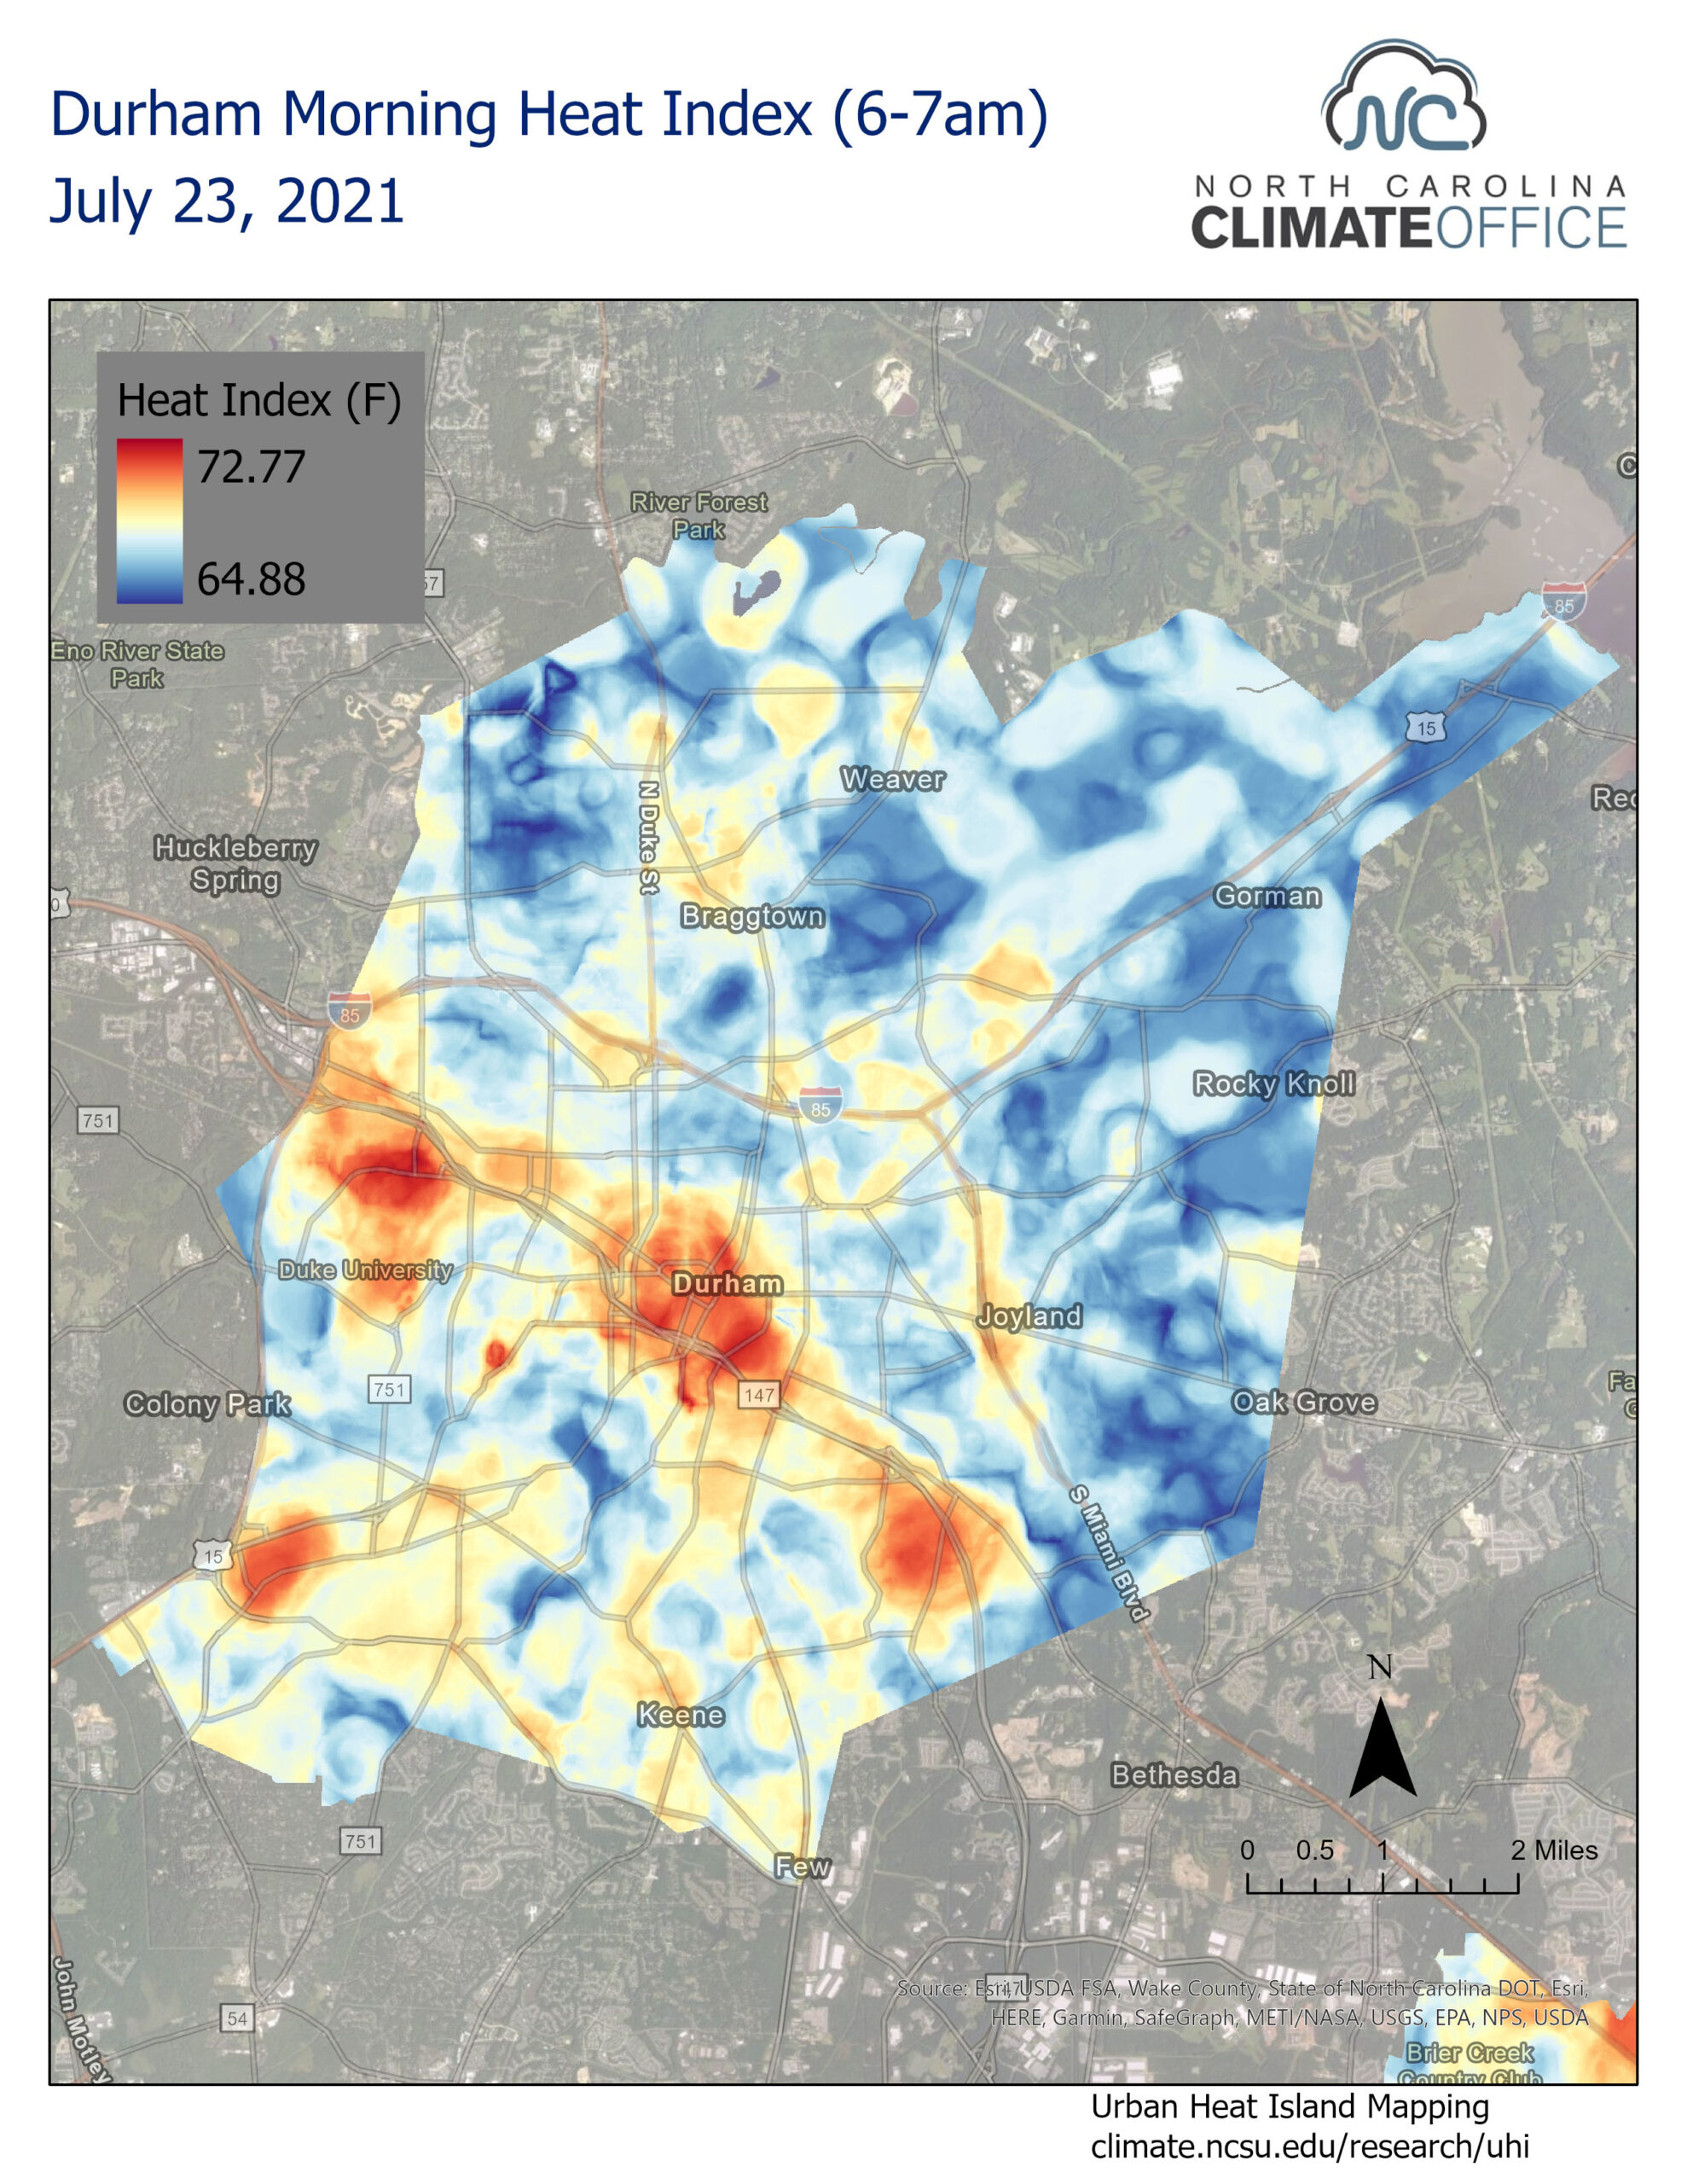
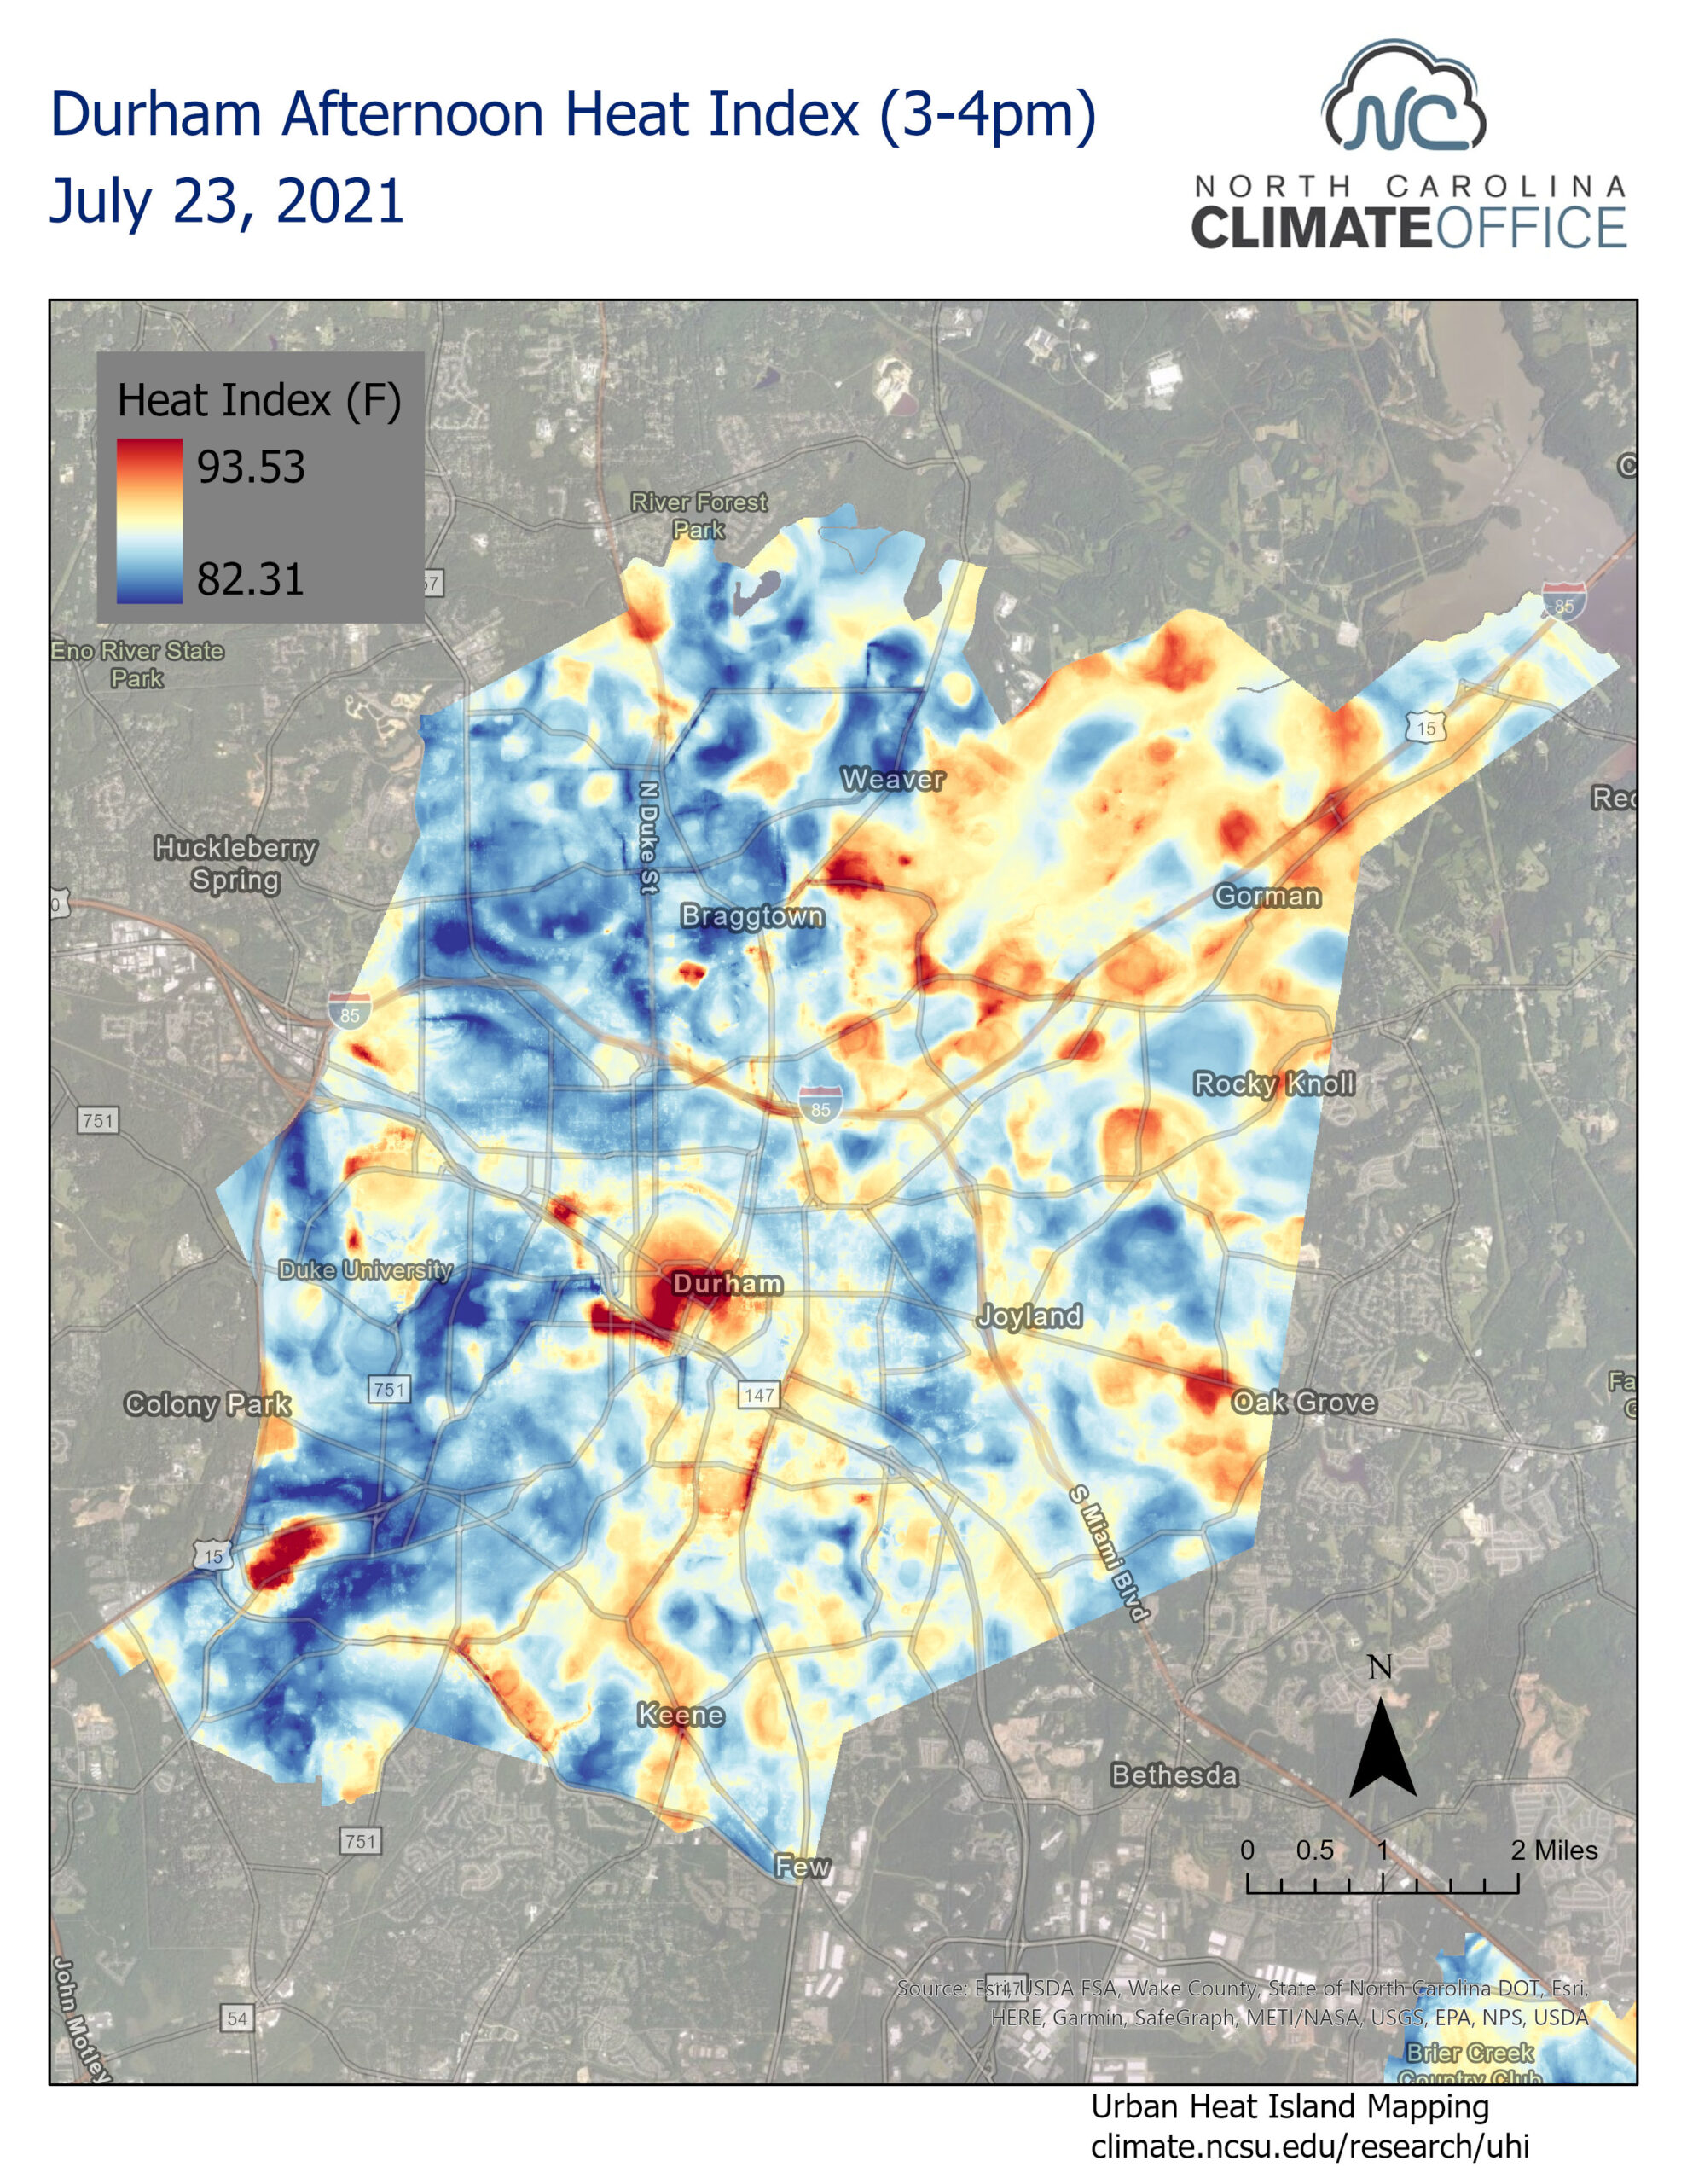
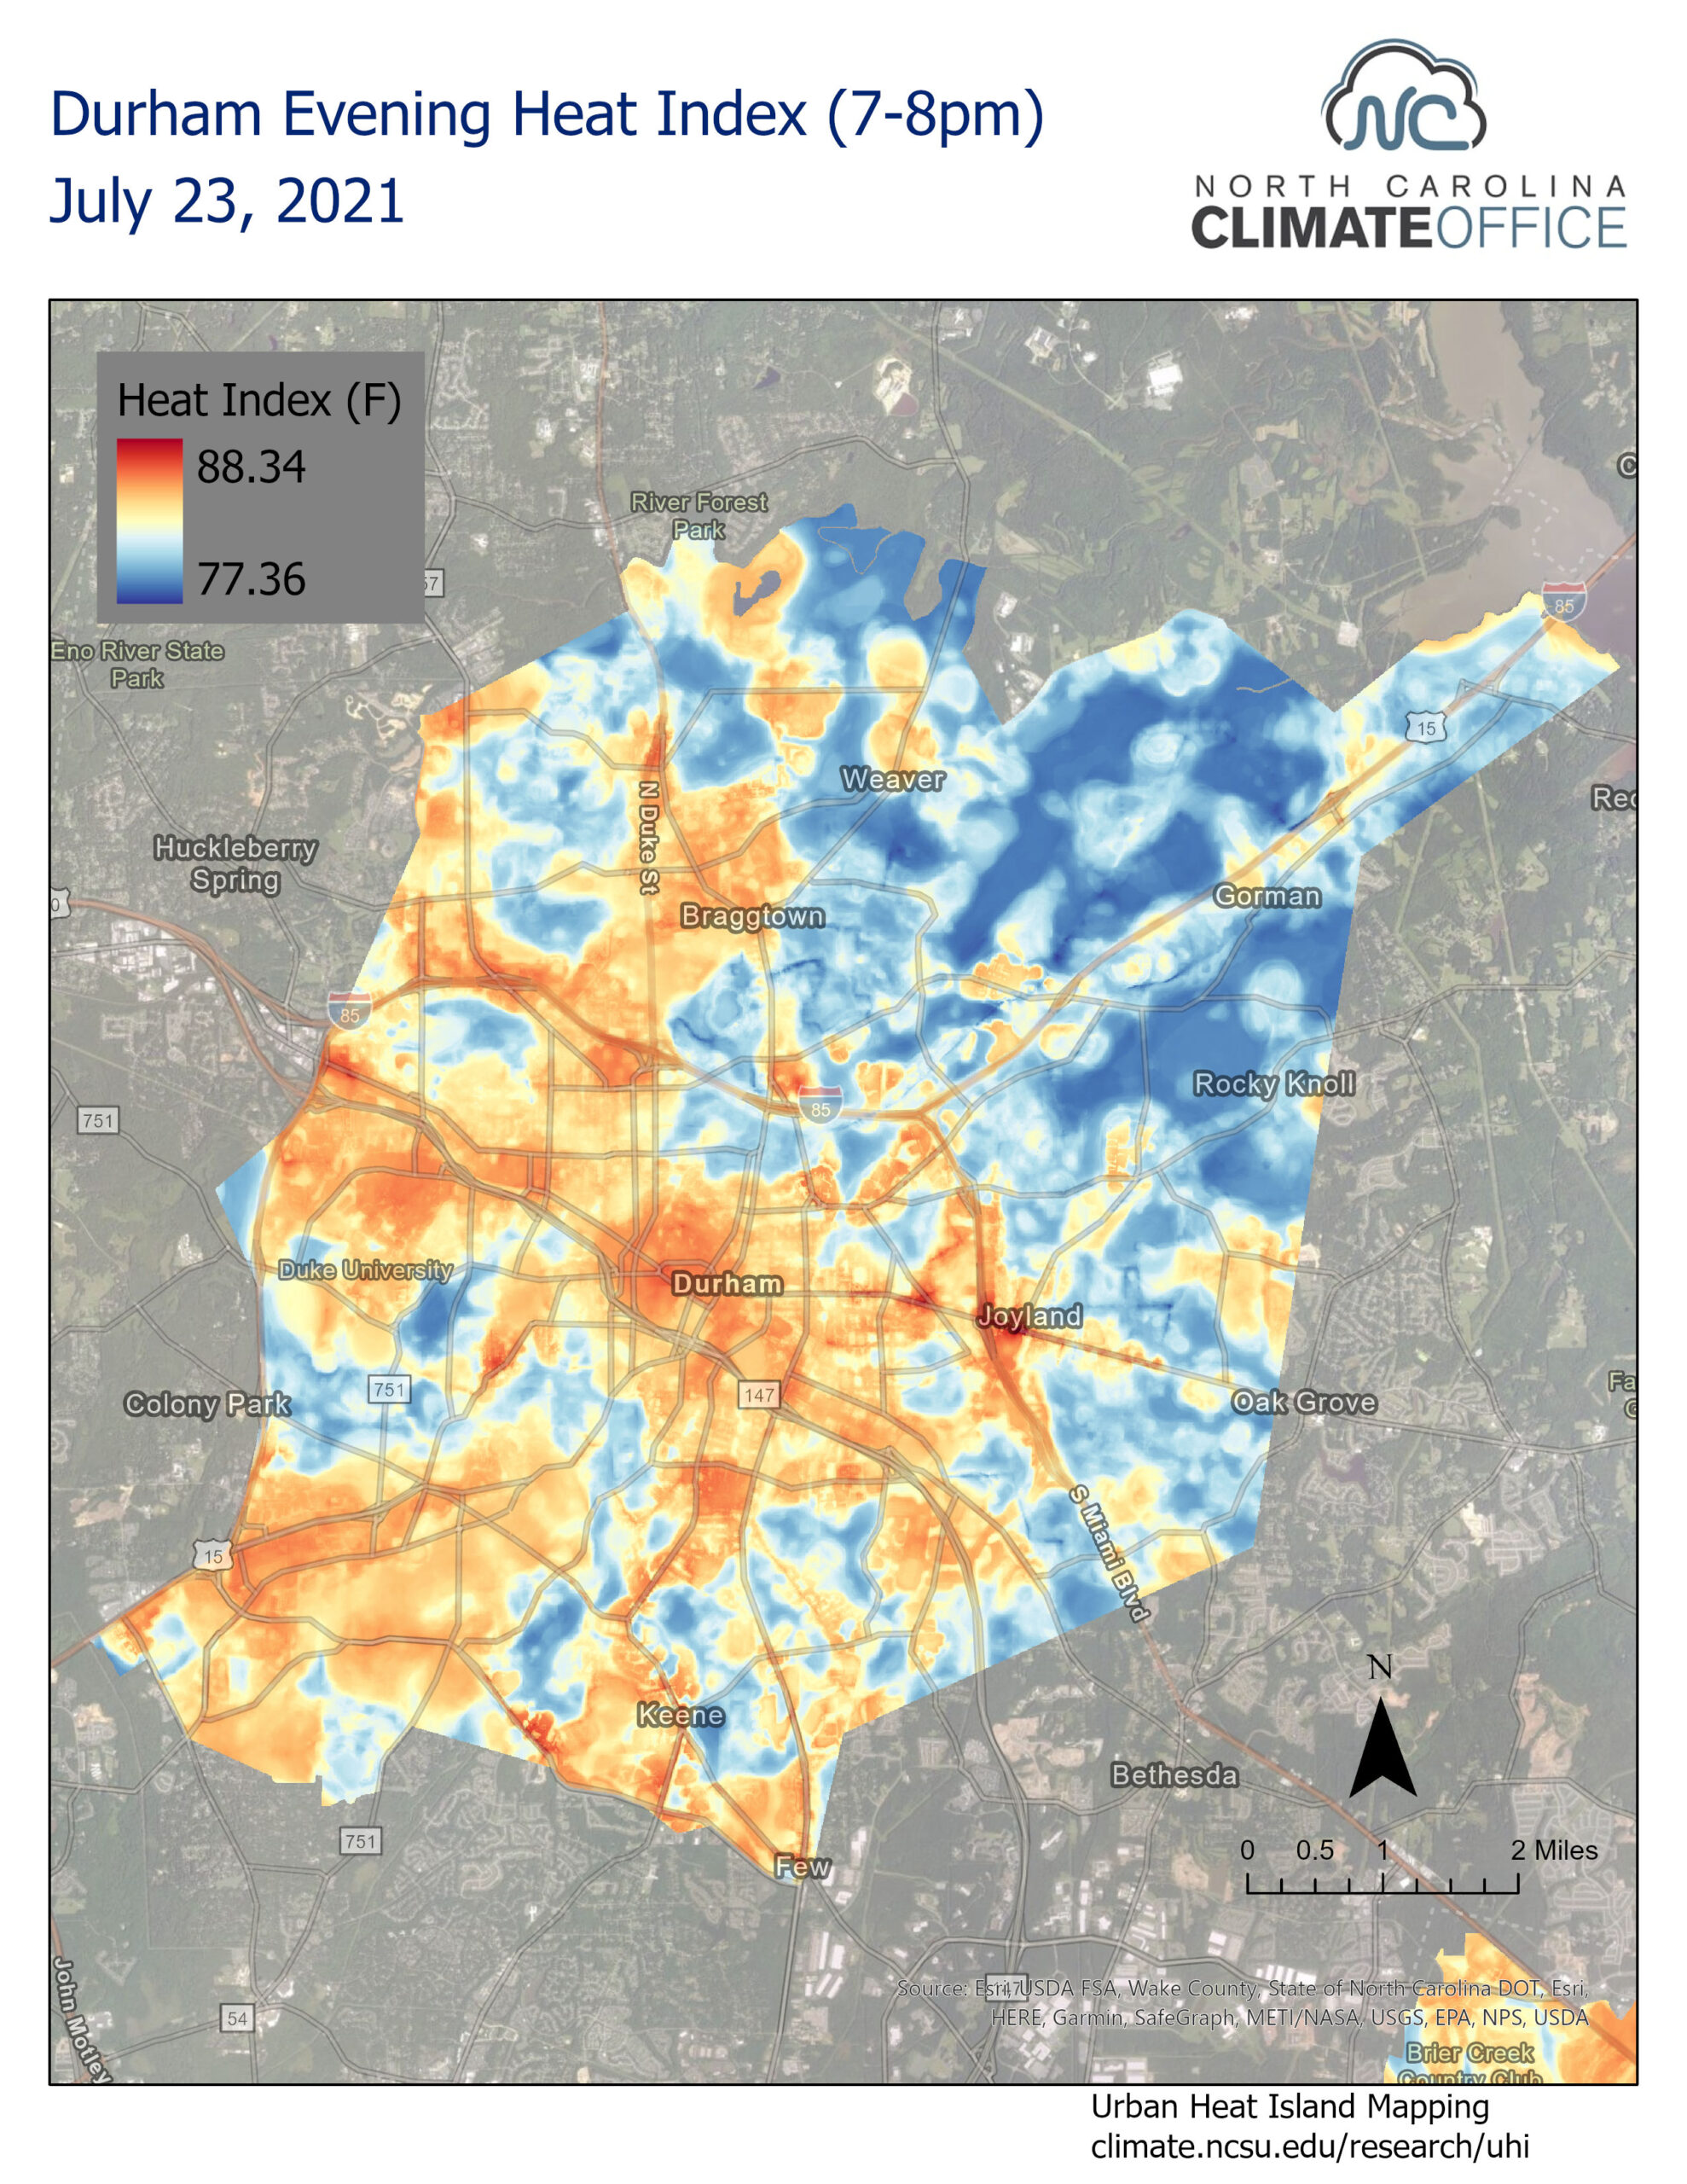
On July 23rd, 2021, scientists and community volunteers hit the streets to better understand where urban heat islands occur in the cities of Raleigh and Durham. Over three time periods throughout the day (6-7am, 3-4pm, and 7-8pm), volunteers collected real-time data including ambient air temperature and humidity. The data were used to develop high-resolution temperature and heat index maps of Raleigh and Durham indicating the hottest/coolest parts of the cities and the extent of the temperature differences between them.
By understanding where the most extreme temperatures occur, ongoing heat mitigation efforts by nonprofits, urban planners, public health officials, and urban foresters will be able to provide resources to areas of the community that are most vulnerable to the impacts of extreme heat.
Map Gallery

Check out the recording of our data release webinar!
Downloads
Results from the 2021 HeatWatch campaign.
- CAPA HeatWatch Report (.pdf)
- README (.txt)
- Driving traverses (.shp)
- Rasters of temperature and heat index (.tif)
Our Partners
The 2021 Raleigh and Durham Urban Heat Island Temperature Mapping Campaign is a partnership between the Museum of Life and Science, NC Museum of Natural Sciences, Durham County, the City of Raleigh, the North Carolina State Climate Office, National Weather Service Raleigh Office, and Activate Good. This project is made possible by NOAA and NIHHIS.