Today, our look at the state of air quality in North Carolina concludes with the third guest post by the meteorologists from the NC Division of Air Quality.
Our final post in this year’s air quality series features a roundtable discussion about how we forecast air quality, the challenges we faced during the 2018 ozone season, and our thoughts on the future of air quality in North Carolina.
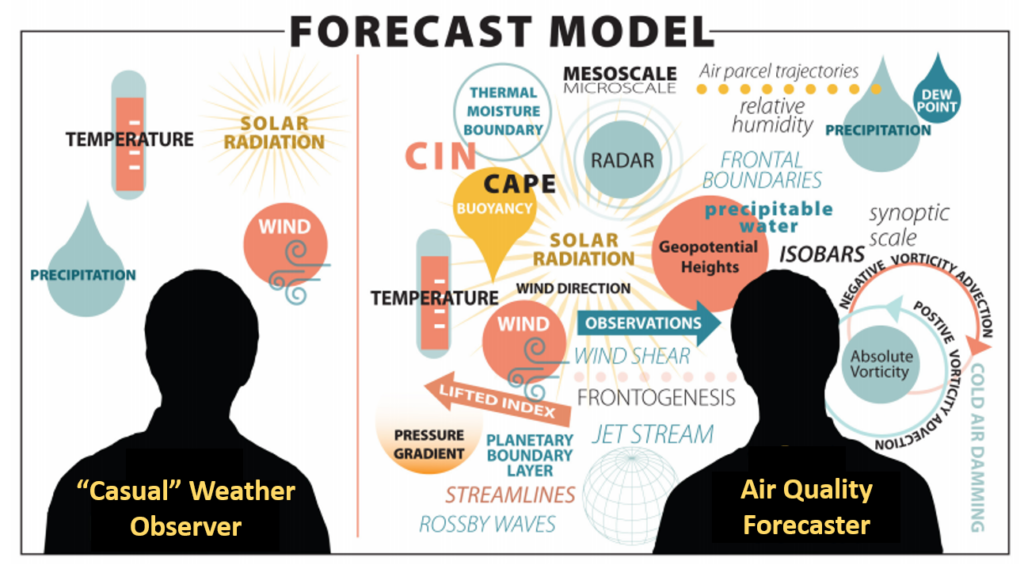
What does it take to be an air quality forecaster?
The DAQ forecasters agree that along with the typical education requirements and forecasting abilities required to be a meteorologist, it’s important to have a solid handle on atmospheric chemistry and how weather affects air quality – and in turn, how air quality affects citizens across the state.
Elliot Tardif, Meteorologist: Looking at external sources to completely build your forecast isn’t an option; you need to build it from scratch to understand where our air masses are coming from, how they might evolve, and how they will impact our air quality.
Rebecca Wiegand, Meteorologist-Intern and Master’s Candidate in Atmospheric Science at NC State: An air quality forecaster needs to understand how ozone behaves, how it forms, and all of the ways it can dissipate. The recognition that your forecast will not always verify at a monitor but may still impact folks is also beneficial. When you hear that people with respiratory ailments are affected by air quality, you know your forecast is helping people. Providing them that information is gratifying.
Bradley McLamb, Meteorologist: We even need the ability and confidence to go beyond the comfort zone of most operational weather forecasters. While precipitation forecasts are often given as a probability from 10% to 100%, we must attempt to definitively predict — either yes or no — whether it is going to because that affects how much ozone will form.
My dad suffered from COPD. When I made forecasts and could personally tell him “Hey, Dad, you might want to avoid being outside for too long this afternoon so you don’t risk getting a flare-up”, I felt like I was making a small contribution to improving his health, and protecting someone I loved from additional health problems.
Nick Witcraft, Meteorologist: Other aspects of our job require skills in scripting, coding, SQL database management, and GIS mapping, just to name a few. All of our meteorologists have master’s degrees and some experience with meteorology and/or air quality modeling.
What is the go-to forecasting tool or technique that you rely most heavily upon when making an air quality forecast?
Forecasts often start with a look at the upper-level atmospheric pattern, including checking for signs of possible clouds and precipitation. From there, several other tools often come in handy.
Rebecca: After looking at those upper-level atmospheric features, I check the air quality in the surrounding states where the next day’s air mass will be coming from. That gives me a good foundation for the forecast.
Nick: For ozone forecasts, I go through a basic checklist. If winds in the lowest 1,000 to 2,000 feet of the atmosphere are greater than 10 mph, ozone is more likely to become horizontally dispersed and vertically mixed over an area, reducing ground-level concentrations. There should be little to no cloud cover, as ozone formation requires sunlight. High ozone days usually include ridging at middle and upper levels, centered near or west of North Carolina. This upper pattern favors the transport of more polluted air into our region, and also lowers the peak height to which the atmosphere will mix to during the afternoon.
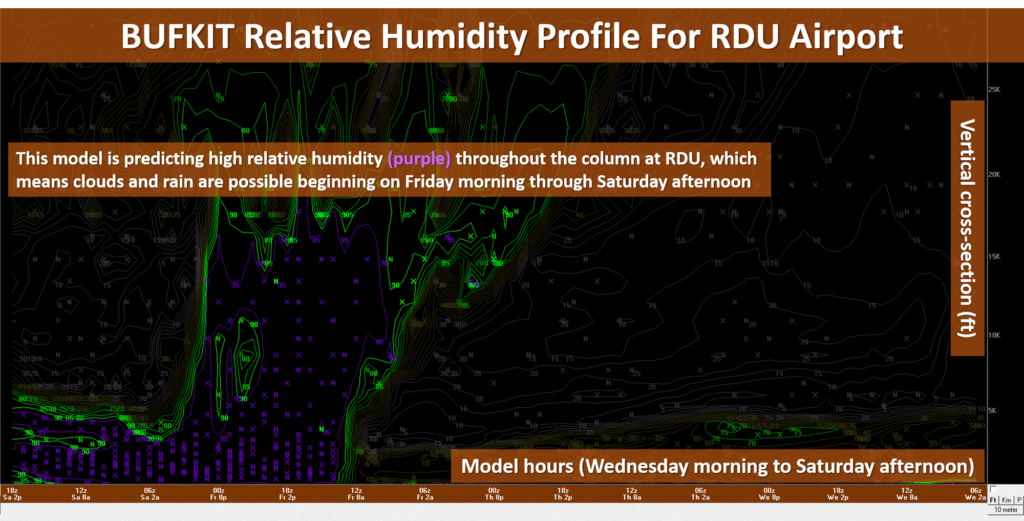
Elliot: My go-to tool is BUFKIT, which was developed by the National Weather Service in Buffalo, NY, to visualize forecast data. I use the precipitation forecast as a screening tool, because if we have a lot of rain in the area then ozone production will obviously be limited or nil, which makes the forecast much easier.
Were there any particularly challenging or unusual episodes during the 2018 ozone season that stand out to you?
Overall, 2018 continued the trend of fewer ozone exceedances across the state, but a few days where ozone had the potential to reach hazardous levels proved particularly challenging to predict and verify.
Elliot: There were many challenging forecasts this year. One particularly difficult case for me was May 1. We had elevated overnight ozone readings along our Ridge Top sites with 8-hour averages above 70 ppb — within the Code Orange range. Trajectories suggested that this air mass would move toward the greater Charlotte region later that day.
In the past, the interaction of that ozone aloft mixing with locally-produced ozone in the Charlotte metro area would yield Code Orange conditions, so I revised the forecast from Yellow to Orange for Charlotte that morning. The high ozone never ended up materializing over the Charlotte region and the forecast busted.
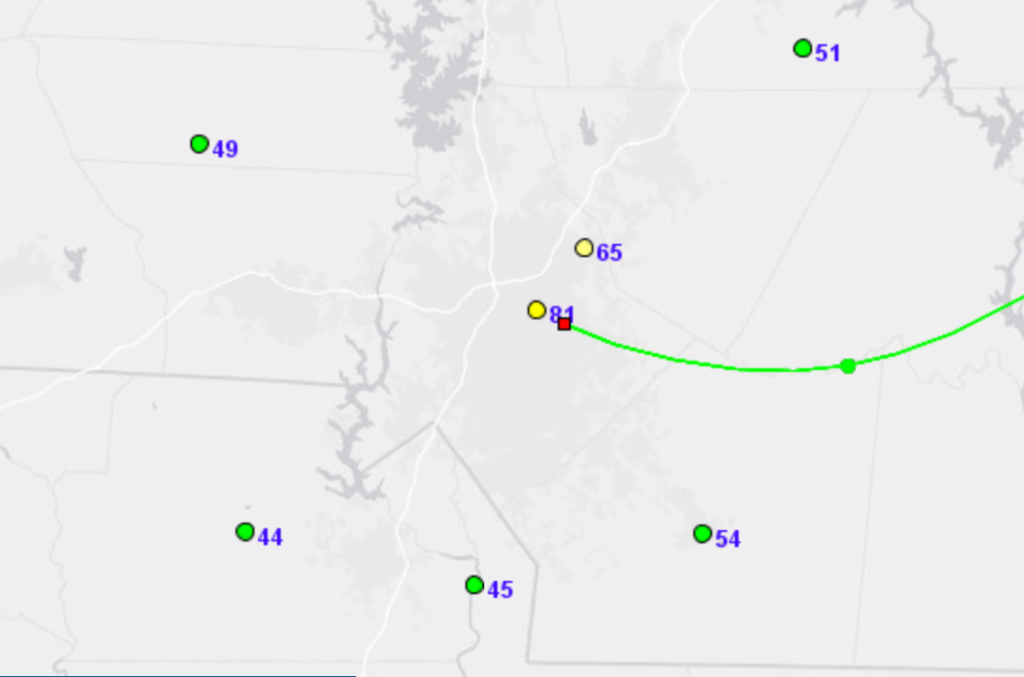
Nick: On June 18, we had a Code Orange forecast but given the west-northwesterly winds, we knew there was a high likelihood that ozone would miss our monitors. Remember, we forecast for people, not sensors!
As expected, hourly ozone concentrations rose to 81 ppb in downtown Charlotte early in the afternoon, then subsided as winds blew ozone to the east into a monitor-less area within northern Union and southern Cabarrus counties.
The daily 8-hour average ozone verified in the upper Code Yellow range in downtown Charlotte, and we are very confident that an area to the east of Charlotte had ozone in the Code Orange range.
A casual look at monitor verification makes it appear that we missed our forecast, while a full review of the air quality and meteorological data would lead to the conclusion that this was, in fact, a verified Code Orange forecast.
Rebecca: All forecasts that had the potential to reach Code Orange! In my experience, it is rare for the ozone potential to go beyond a borderline Code Orange, and a number of factors have to align to reach that potential.
Talk about the future. What do you see happening to air quality in North Carolina, and how will that impact the profession of air quality meteorology?
Air quality appears likely to continue improving in the future, the DAQ forecasters agree. That may present some opportunities and challenges when it comes to monitoring and communicating their forecasts.
Elliot: One key factor will be how the EPA standards may change. Will the Code Orange threshold stay at 71 ppb, or will it be lowered? That will frame the conversation about what is considered unhealthy air quality. Regardless, though, there will always be a forecast.
Nick: We are cautiously optimistic about the likely proliferation of low-cost sensors to supplement our existing monitoring network and provide more widespread coverage. However, we will need to ensure that the data is of relatively high quality and can be used to adjust and verify our forecasts.
Bradley: With fewer poor air quality days, the task for us as air quality forecasters will only grow harder. The future looks wonderful from an air quality perspective and evermore challenging for those trying to pick out the rare days on which health impacts due to the air quality will occur!
If you have additional questions about air quality forecasting, you can email Bradley (bradley.mclamb@ncdenr.gov) or Elliot (elliot.tardif@ncdenr.gov) at the NC Division of Air Quality.