It was a Jekyll and Hyde weather month in North Carolina as we switched weather patterns midway through July. Our latest climate summary has a closer look at our precipitation swings, moderate temperatures, and an update on ENSO conditions in the Pacific.
From Bone Dry to Soaking Wet
It was a tale of two halves of the month, marked by an atmospheric pattern shift in the middle of July. The wet ending left us with above-normal precipitation overall, as the preliminary statewide average precipitation of 6.79 inches ranked as our 27th-wettest July on record.
The first two weeks of the month were dry almost everywhere, with less than 2 inches of rain reported in most locations and less than an inch in some parts of the Piedmont. During that time, the jet stream was well to the north, which allowed warm air to move in from the south and blanket much of the continental US with above-normal temperatures.
By the middle of the month, a trough in the jet stream formed over the eastern US. Following this storm track, several systems dropped down from the Ohio Valley to soak the mountains, and by the end of the month, the eastern half of the state also saw heavy rainfall as moisture-rich air moved in from the Gulf of Mexico and the Atlantic Ocean.
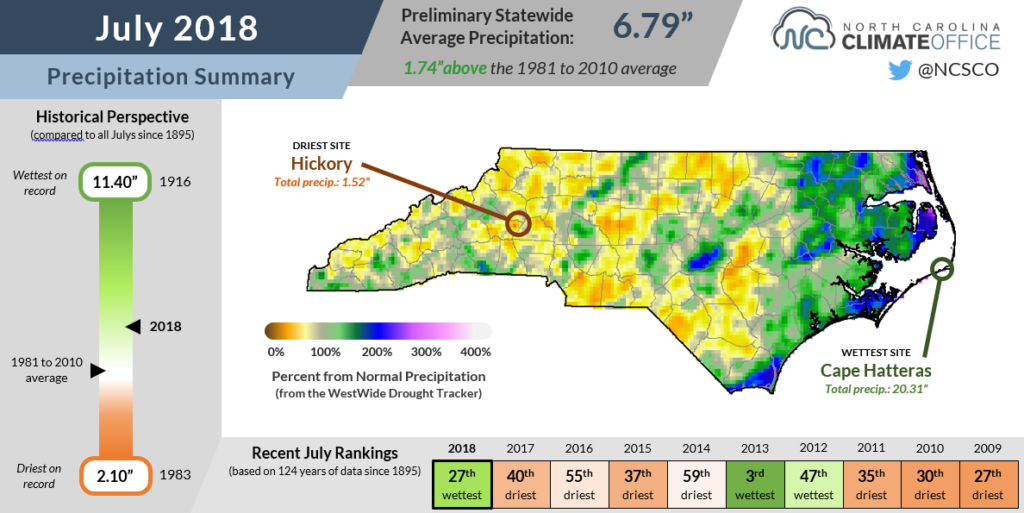
Cape Hatteras was the epicenter for wet weather last month. On five out of the six days between July 20 and 25, the Hatteras Airport received more than two inches of rainfall. For the month as a whole, that station reported 20.31 inches of precipitation — not only their wettest July on record dating back 125 years, but also the wettest month on record at Hatteras, surpassing September 1989, when they received exactly 20 inches.
Other soggy sites last month included Wilmington, which had 17.10 inches of rain and its 4th-wettest July since 1874; Edenton, where the 12.13 inches of rain ranked as the 8th-wettest July out of 113 years with observations; and Elizabeth City, which recorded 11.13 inches and its 6th-wettest July since 1934.
The transition from dry to wet weather made for a busy month in the drought monitoring realm. After starting the month with none of North Carolina classified as dry by the US Drought Monitor, a few weeks with limited rainfall allowed Abnormally Dry conditions to creep back into the western Piedmont and central Coastal Plain.
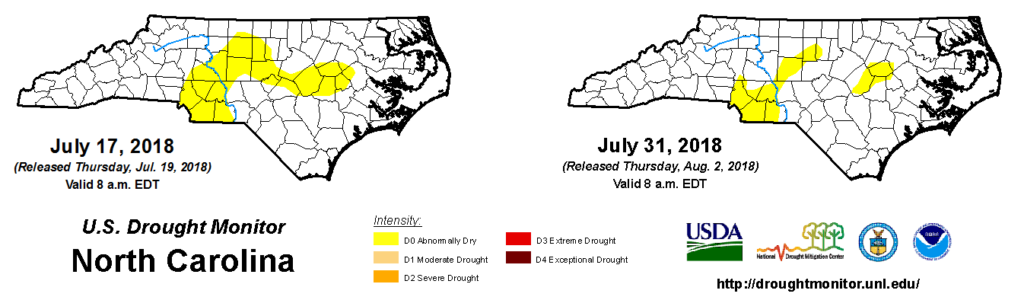
The onset of a wetter pattern helped remove some of that dryness, although parts of the western Piedmont still have precipitation deficits since the start of the summer and below-normal deep soil moisture levels.
The pattern change also meant frustration for farmers who saw crops dry out before having their fields flooded. Extension agent Charles Mitchell noted that “Franklin County is finally receiving much needed rains [but] for some fields of tobacco and corn, it is too late.”
While our topsy-turvy weather might have left some crops confused, the recent rainfall has — and will continue to — bring some improvements to our US Drought Monitor status, and it may have saved us from entering drought this summer.
Cloudy Weather Keeps Temperatures in Check
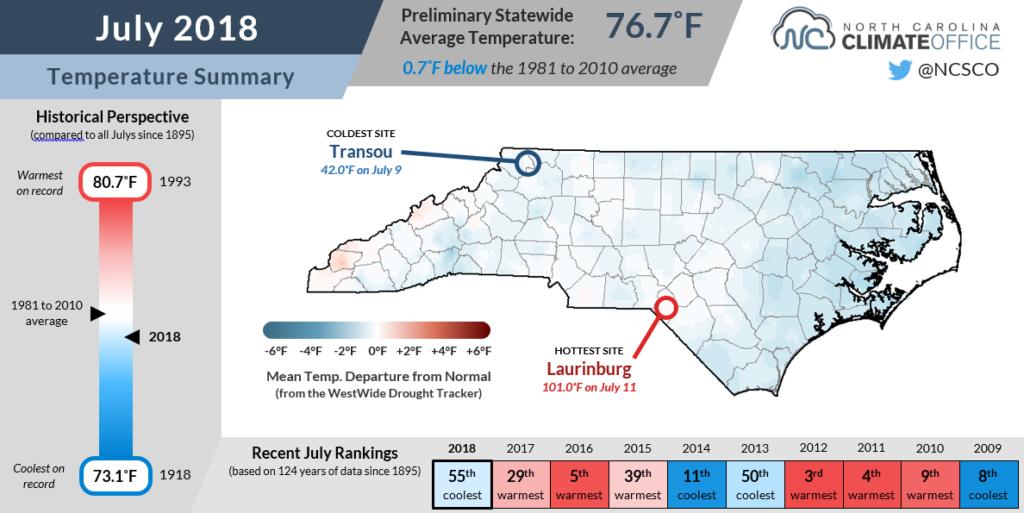
The mid-month onset of a wetter pattern was accompanied by lots of cloud cover, which helped moderate our temperatures and yielded near-normal conditions overall. The preliminary statewide average temperature of 76.7°F ranks as our 55th-coolest — or 70th-warmest — July since 1895.
Cloudy mornings did mean high-ranking average low temperatures at sites such as Asheville, which tied for its 7th-warmest July in the past 126 years. But those rankings were generally balanced out by cooler daytime high temperatures, giving us a month with mean temperatures around half a degree below normal.
While the latter half of July is often when we see our warmest weather of the summer, that wasn’t the case this year. Instead, the highest temperature in the state of 101°F in Laurinburg came earlier in the month on July 11.
The highest temperature reported at any of our ECONet stations was 99.3°F in Hamlet. In fact, it has now been more than two years since any of our ECONet stations reached the century mark. The last such occurrence was at Salisbury on July 27, 2016.
Just because we haven’t seen any triple-digit heat, it doesn’t mean that we didn’t notice some interesting characteristics in our stations’ temperature data last month. Before the cloudy, wet weather arrived, we actually observed some impressive temperature swings at a few of our ECONet sites.
At our Wallace station in the southern Coastal Plain, morning low temperatures on July 10 reached 56.1°F before climbing all the way to 92.3°F later that day. That 36.2 degree difference is the greatest ever observed at that station in the month of July, although it’s still a bit off from the all-time record of 56.8 degrees, which occurred at Mount Mitchell on January 6, 2014.
El Niño Looking More Likely
Was last month’s pattern change from dry to wet due to the emerging El Niño?
It’s tempting to think so since El Niño does often bring us wetter fall and winter conditions. But besides the fact that we’re still in the summer, when ENSO’s influence on our weather tends to be very limited, we also haven’t quite reached El Niño status yet this summer.
We are now more confident in El Niño arriving later this year, though. Equatorial Pacific sea surface temperature anomalies are above-normal and the latest three-month average anomaly puts us in a warm neutral ENSO phase.
Although we’re still not entirely past the summertime ENSO predictability barrier due to the often rapid changes in ocean temperatures this time of the year, a bubble of reinforcing warm water beneath the surface gives us a bit more confidence in the current model forecasts showing a weak to moderate El Niño emerging this fall.
The buildup of warm water associated with El Niño usually triggers an increase in cloud cover and thunderstorm activity over the central Pacific. We can monitor this by looking at the level of outgoing longwave radiation. A warm surface will release much more of this radiation than a cool cloudtop.
Because we’re still seeing above-normal outgoing longwave radiation anomalies in this region (see the map on the left), we know that El Niño and its atmospheric impacts aren’t quite here yet. But given the recent progression of oceanic conditions, it may only be a matter of time before they arrive.
Sea surface temperatures aren’t the only clues about ENSO’s evolution. For some more technical insight into the current ENSO pattern, be sure to check out the recent NOAA ENSO Blog post by Dr. Jason Furtado describing how pressure anomalies in the south Pacific can also help us understand how a potential wintertime El Niño event might look.