By the Numbers: August and Summer 2017

In lieu of our typical climate summary post, we’re taking a condensed look at some stats from the past month and season.
August Temperatures
75.16°F: August’s average statewide temperature, which was just under a degree below the long-term 1981-2010 average. It ranked as our 50th-coolest August out of the past 123 years.
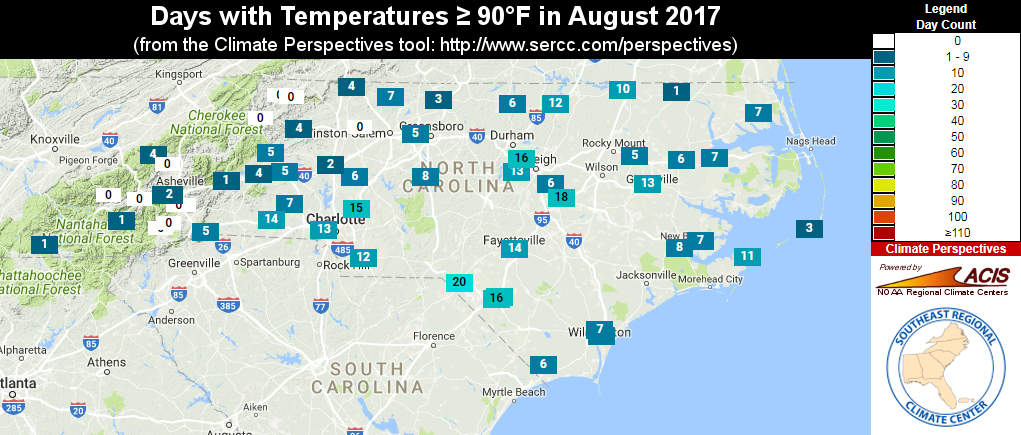
20 days: The number of times temperatures hit at or above 90°F in Laurinburg — the most of any site in the state. Outside of the southern and eastern Piedmont, the heat was less abundant, with fewer than 10 days reaching 90 degrees. In fact, those cooler maximum temperatures were one of the main drivers in our slightly below-normal monthly average temperature.
118 years: The period of record length in Mount Airy, which just recorded its 10th-coolest August. Statesville (9th-coolest August in the past 110 years) and Roxboro (5th-coolest August in the past 70 years) also finished on the cool side last month.
Precipitation Perspectives
5.50 inches: The statewide average precipitation in August, which was 0.44 inches above the 1981-2010 average. It ranked as our 49th-wettest August since 1895.
12.66 inches: The total August rainfall at Longwood in western Brunswick County — one of the wettest spots in the state last month. On five different days, Longwood reported precipitation totals of more than 1 inch.
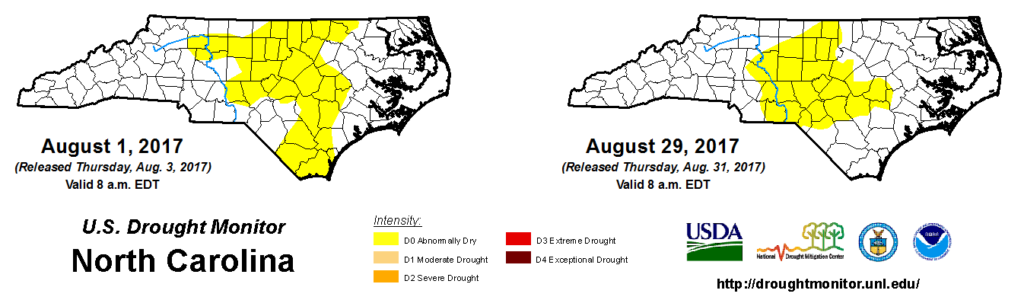
25.69%: The amount of North Carolina classified as Abnormally Dry on the US Drought Monitor at the end of August. Those dry areas are primarily located in the central and eastern Piedmont and interior Coastal Plain.
6.22 inches: The total precipitation at our Siler City ECONet station in Chatham County over the past three months, giving it less than two-thirds of its normal summer rainfall. Siler City is among the lingering Abnormally Dry areas headed into the fall.
Summer Stats
102°F: The highest temperature reported in North Carolina all summer, which occurred on July 23 at both the Raleigh-Durham Airport and the Fayetteville Airport.
+0.01°F: The difference between the average statewide summer temperature and the long-term 1981-2010 average. While July was warm, June and August were both slightly cooler than normal, producing our 61st-coolest (or 63rd-warmest) summer on record.
4th-warmest: Despite the near-normal summer, we’re still on pace for our 4th-warmest year on record statewide thanks to our warm winter and spring. Both Raleigh and Hatteras have had their warmest year on record through the end of August, while Greensboro, Charlotte, and Wilmington are having their second-warmest year to this point.
+0.24 inches: The difference between the average statewide summer precipitation and the long-term 1981-2010 average, making it our 54th-driest summer on record.
1958: The last year with such small departures from normal of our summer average temperature and precipitation. Although it’s easy to think of normal as a typical occurrence, remember that it’s just an average of many different years and their weather variations. Hitting normal right on the nose isn’t as common as you might think!
Eye on ENSO
-0.15°C: The August sea surface temperature anomaly in the Niño3.4 region in the central Pacific Ocean according to the Climate Prediction Center. Temperatures jumped from warm neutral to cool neutral last month — the latest sign that an El Niño is probably not developing as it appeared it would during the spring.
55%: The odds of having ENSO-neutral conditions this winter, according to a model-based forecast from the International Research Institute for Climate and Society. Their forecast gives a 21% chance of wintertime El Niño conditions and a 24% chance of a La Niña developing.
- Categories:


