Lingering Wintry Weather Throughout a Cool March
With the arrival (finally!) of warmer temperature across the state during this first week of April, many may be quickly leaving the memory of March — with its cooler temperatures and winter storms — in the past. Before we get too far into April, we thought we’d ask: how did March 2014 stack up against previous years?
Monthly statistics for March 2014:
Statewide Average Precipitation:: 4.45 inches (55th wettest since 1895)
Statewide Average Temperature: 4.85°F (11th coldest since 1895)
* Values generated from preliminary numbers
A Colder March
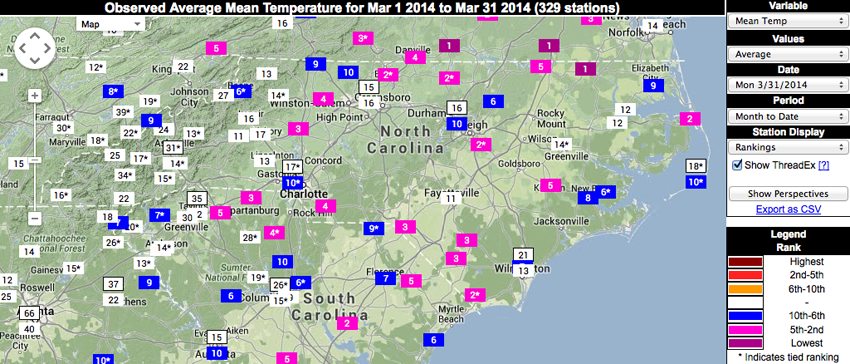
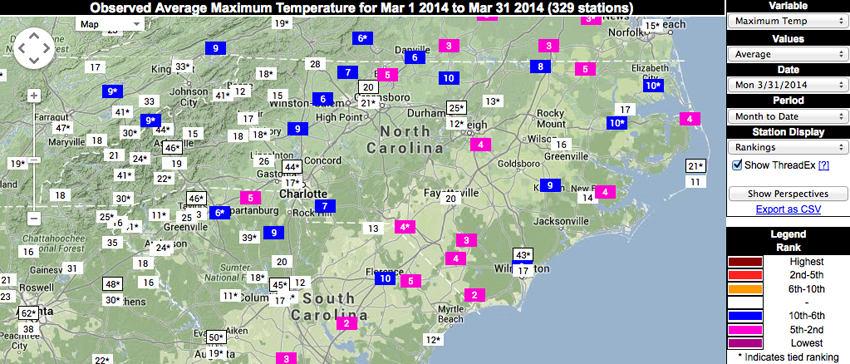
In terms of temperature, March was firmly on the colder side, ranking 11th coldest since 1895 statewide. The following three graphics — station rankings for maximum, minimum, and mean temperatures — indicate that temperatures for many locations across the state ranked in the top ten or top five coldest.
Looking at maximum temperatures, many locations in the eastern half of the state saw temperatures in the top 5 or top 10 coldest, while the mountains and foothills were not as highly ranked. Maximum temperatures in Kinston for March were the 9th coldest based on a record of 107 years.
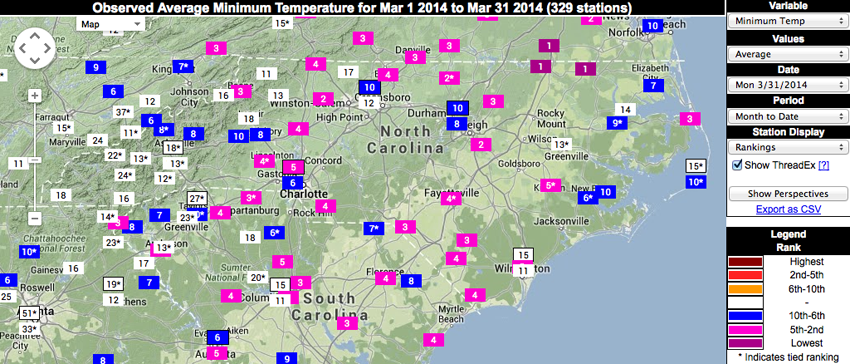
Compared to the map of maximum temperature rankings, the map of minimum temperature rankings show more extreme cool rankings. Multiple locations with top-5 coldest minimum March temperatures had over 100 years of data to compare to, such as Louisburg, which ranked 3rd coldest based on 115 years of records, and Mount Airy, which ranked 4th coldest based on 114 years of records.
March mean temperature rankings reveal a similar picture to the maximum and minimum temperatures. Clayton, Roxboro, and Reidsville all tied for their 2nd coldest March (based on 51, 68, and 51 years of data), while Statesville saw its 3rd coldest March on record, based on 103 years of data. In the mountains, there were fewer locations that ranked in the top 10 coldest, but quite a few had mean temperatures ranking between the 10th and 20th coldest on record.
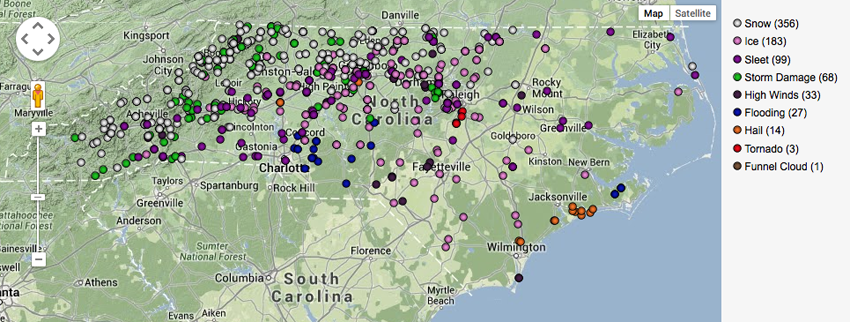
A Busy Month for Weather
When it comes to weather, March saw plenty of it. Winter was slow to release its hold over the state, and many places saw snow, ice, and sleet. We even had some spring-like weather, with reports of high winds, hail, and even a few tornado reports!
Dry in the West to Wet in the East
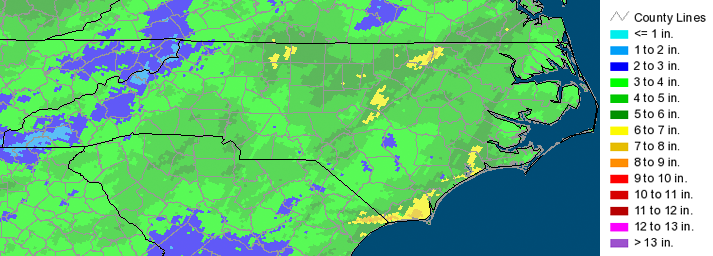
Statewide, March 2014 ranked as the 55th wettest March since 1895. Precipitation for the month was varied across the state and generally increased from west to east. Many stations in the mountains received less than 3 inches of precipitation in March, while the Foothills and western Piedmont generally saw 3 to 4.5 inches. The rest of the Piedmont and Coastal Plain saw mostly 5+ inches.
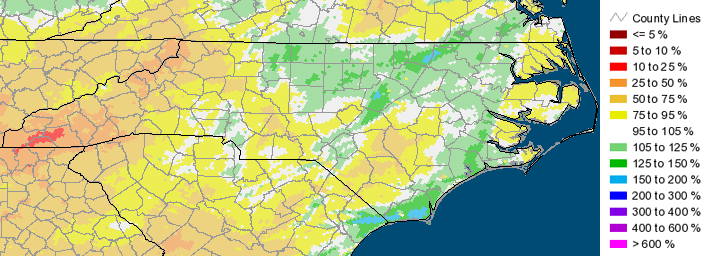
How does this precipitation compare to what March normally receives? Except for the mountains, which we’ll get to shortly, most of the state was near normal. Locations in the northern Piedmont, as well as areas in the Coastal Plain running roughly in a southwest-to-northeast line from Brunswick County to Hertford County were slightly above normal.
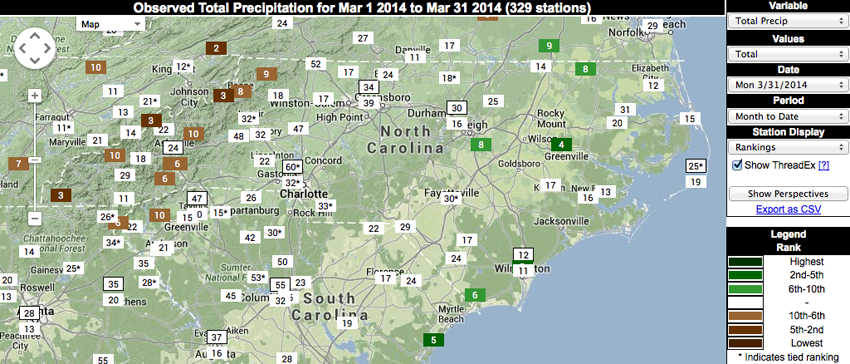
When we look at how March precipitation ranked, notice that some stations on that same southwest-to-northeast line ranked in the top 10, with others ranking in the top 20. Why only in these locations? It’s likely due to a late-in-the-month line of showers on the 28th and 29th that resulted in over 1.5 inches for these areas.
Developing Drought?
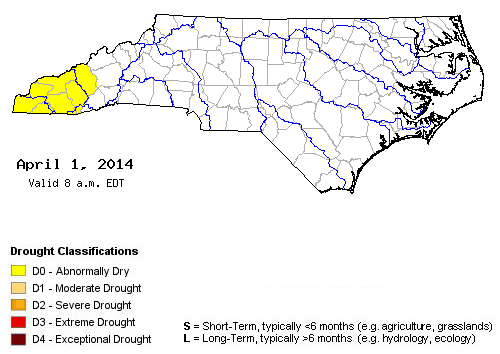
Over the past few months, the mountains have been receiving comparatively less precipitation, and March was no exception. This deficit in precipitation in the mountains has resulted in some lower streamflow and groundwater levels over the past month, and US Drought Monitor maps have started to reflect these conditions.
A small sliver of D0 (“Abnormally Dry”) was introduced in the southwest corner of North Carolina on March 18. On March 25, this was expanded to include most of Cherokee, Clay, and Macon counties, and as of April 1, this area has grown to include Graham, Swain, Haywood, and Jackson counties. Even though the mountains didn’t have temperature rankings as high as their eastern counterparts, they still remained cold for much of March. Many mountain locations observed mean temperatures in the mid 40s, which is cold enough to limit much evaporation, as well as impede favorable conditions for plant growth. As temperatures warm and plants start to grow and draw water, we’ll have to keep an eye on the conditions in the western part of the state.
- Categories:


