This post is part of a series highlighting the summer projects from our office’s undergraduate research assistants. First up is Colin Loftin, a senior in Meteorology at NC State.
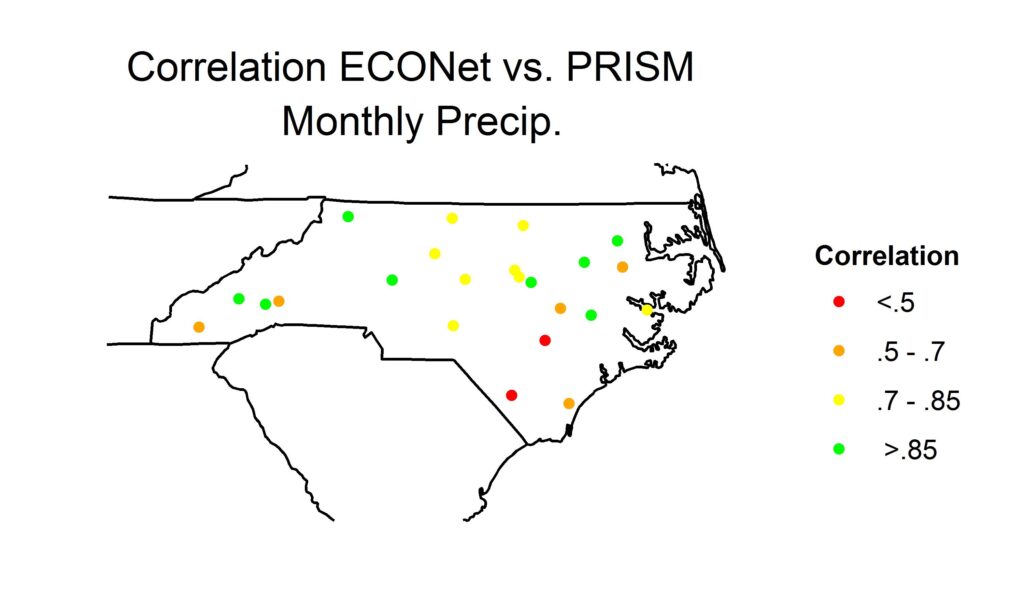
This summer I completed two separate projects. For the first half of summer, I worked on a comparison of daily MPE (Multi-Sensor Precipitation Estimates) and PRISM (Parameter-elevation Regressions on Independent Slopes Model) precipitation estimates.
The purpose of this comparison was to determine if either precipitation estimate was able to adequately replace missing or erroneous rainfall data being gathered from field sensors. Missing data is a big problem for scientists using models in sectors such as agriculture and hydrology. In fact, crop models will come to a screeching halt if the weather data has a missing row.
Over the course of the study, MPE routinely provided a more accurate daily estimation when compared to the ECONet precipitation sensors, while PRISM was more accurate over a monthly period.

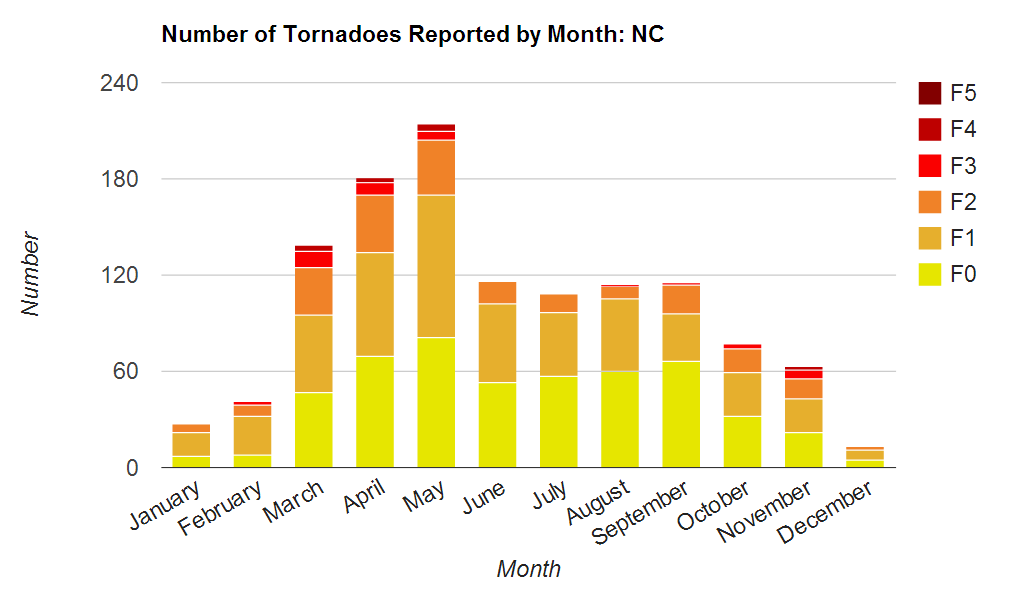
The second half of the summer was spent overhauling of the existing severe weather pages. Introductory materials were re-organized for these topics: tornadoes, hail, and high winds. The update included dynamic, up-to-date charts and graphics.
Note: These graphics are now accessible on our Severe Storm Reports Tool.
Users can interact directly with this data by choosing between three different time scales (by month, by year, by decade), as well as having the ability to view the data, as well as being able to view different intensities of tornadoes (F-scale), hail (diameter), and wind speed (knots). The charts allow the user to hover over a point to view the specific numbers for the selected time period. The new pages also include a table that contains the raw data broken down by the selected time scale (by month, by decade, by year). In addition, users can choose to view data from any of the 50 states in the country, but the pages default to North Carolina.
