We’re proud to officially launch our new-look website today, and our current design is more than just a fresh coat of paint. Here’s an overview of what you will find, headlined by our new data request tool that makes it faster and easier than ever before to access weather and climate data from across North Carolina.
Need Data? Flock to Cardinal!
Our CRONOS Database hit a milestone this year: its eighteenth birthday! In the web world, that makes it ancient, and in this era of instant access on any device, it was time for something new.
We hatched a plan, and the result was Cardinal, our new data access system. Here are a few of the highlights:
- Data is free for all users. You only need an NCSCO user account (also free) to access historical weather observations. While we do limit the number of data points you can retrieve per request, per day, and per month in order to reduce demands on our database, most requests should fall under these limits.
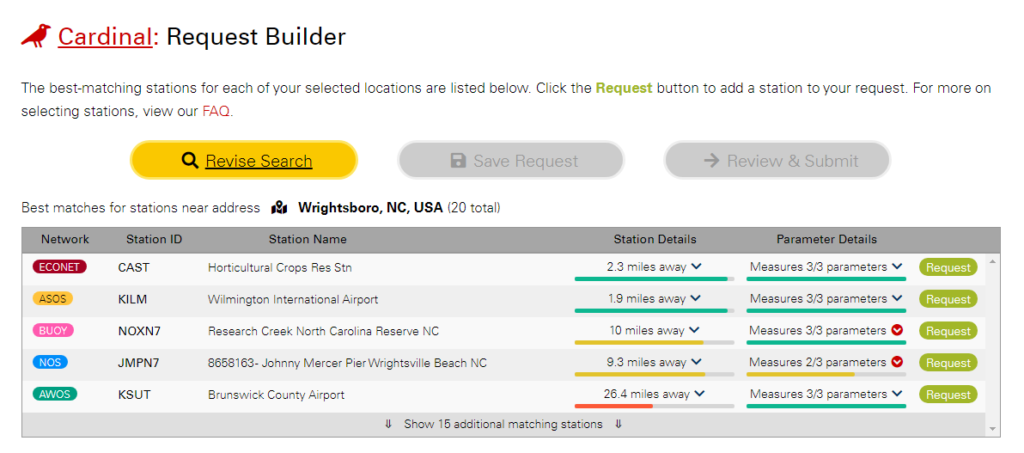
- The data you need is a simple search away. If you’re sweating over which stations measure relative humidity, or if ASOS sounds like something you’d dip your fries in, then fear not! Cardinal takes the guesswork out of identifying the best weather stations for your request. Using the Request Builder and its step-by-step interface, select the locations you’re interested in, the time periods over which you want data, and the parameters you need, and the Cardinal system will show you which stations are the best match.
- Requests are now fully automated. After submitting a request using the Request Builder, you should have your data in just seconds as its automated routines retrieve and prepare your data faster than ever before. Whether you want data from 2020 or 1920, it’s all accessible in an instant through Cardinal.
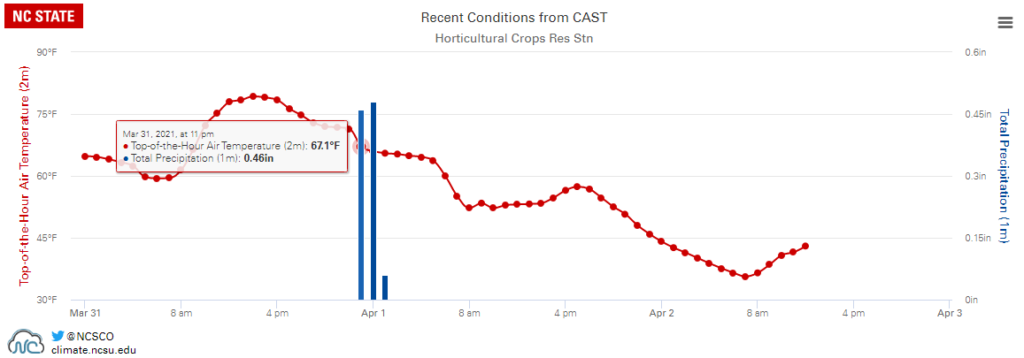
- New insights into weather stations. If you’re looking for the latest local conditions or exploring the history of a particular weather station, let the Station Scout tool in Cardinal be your guide. It uses intuitive, graphical displays to show current conditions, station details, historical availability, and recent data. With hundreds of active weather stations, there is always plenty to discover!
Note that since support for Cardinal was provided by our partners at NC State Extension and other in-state funding, Cardinal is limited to weather stations in North Carolina. If you’re looking for data from other states, consult the National Centers for Environmental Information or your local state climate office.
Our ECONet, in Detail
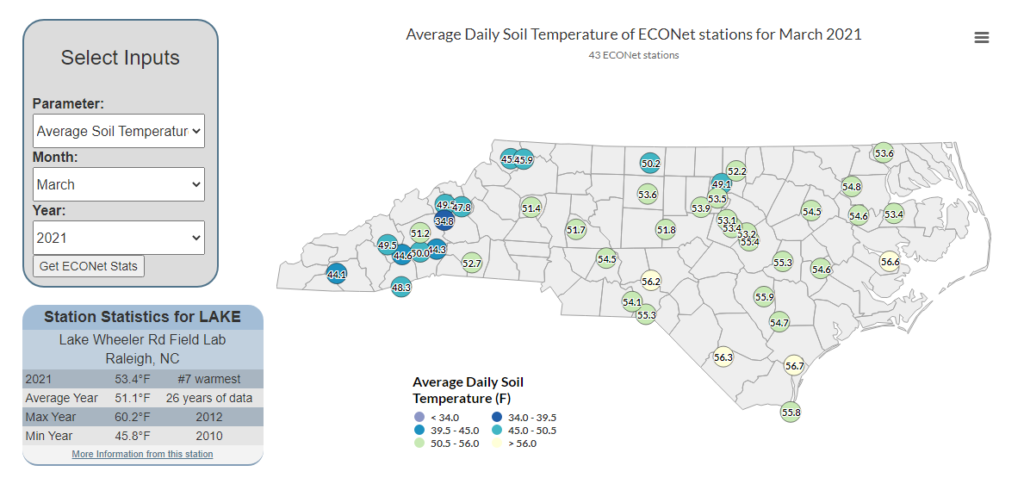
Did you know that North Carolina has its own network of research-grade weather observing stations? Our office maintains the NC ECONet, a set of 43 stations (and counting) at ag research farms, mountain peaks, and other sites across the state.
You’ve likely seen ECONet observations in our climate summaries, on our homepage, and maybe even on the evening news! Now, you can explore these stations and how their data is being used on our new ECONet site.
You’ll find the familiar statewide summary map there, along with station-specific pages showing current conditions, sensor information, and photos from each site. And we’re sharing ECONet-based research applications such as monitoring heat stress, and products like our Monthly Snapshot Viewer tool.
The Resources You Remember
While we have retired CRONOS after nearly two decades of service, we’ve made the website move along with many of our other existing tools, which you can now find on our Products site.
If you’re getting spun up on past tornadoes and severe weather events, check out our Severe Storm Reports Tool. Investigating past tropical storms is a breeze using our Hurricanes Database. And you’ll find a flurry of snowstorm history in our Winter Storm Database.
Our Climate Blog will also continue to tell the story of weather and climate in North Carolina. If you’re already subscribed to our mailing list, then you’ll continue to receive emails about new posts as they’re released. And if you’d like to join, just fill out the form on the main blog page.
We’ll be adding more information to our website in the months ahead, including additional North Carolina-specific activities and climate change content to our revamped educational pages, findings from our research projects, and additional tools to help you explore data from around the state.